reports_details - ਆਰਬੀਆਈ - Reserve Bank of India


Report on Municipal Finances

Draft Report of the Internal Working Group on Implementation of Counter-cyclical Capital Buffer
 provide-feedback
0.1 Businesses are prone to the impact of boom-bust economic cycles. Banking business is no exception to this; rather banks are more prone to economic cycles as they have exposure to many business entities at any given time and the combined effect of the performance of all these entities is to be borne by the banks in all phases of the economic cycles. This dimension of pro-cyclicality, is what makes banking different from other businesses. It accentuates the ill-impacts of economic cycles in a feedback loop, i.e., the cycle becomes self-fulfilling, increasing in size and causing externalities to the economy and society. 0.2 In boom times, there is more demand for credit and banks tend to become aggressive, which could lead to relaxation in credit standards and in excessive credit growth. Debtors tend to do well and service the loans in time. They also improve their financials as also their credit ratings. Banks’ loan losses and capital requirements fall below their long-run average and the need for loan loss provisions are less. Banks make good profits as the loan loss provisions are low. Despite higher credit growth, banks typically do not need commensurately higher capital as their borrowers are likely to have good credit ratings and as per Basel capital requirements, high rated borrowers require less capital. A higher amount of profits is thus distributed as dividends. 0.3 When the economic cycle turns, borrowers’ credit quality tends to worsen, leading to a higher probability of default in servicing interest and principal re-payment. Some of these loans become non-performing assets (NPAs). Banks’ profits start dipping or they may even start making losses, resulting in write-off of capital. At the same time, they are required to make higher loan loss provisions for the non-performing loans and maintain higher capital for the rating down-gradation of their borrowers. With their poor financials, banks do not get external capital to support their existing loan portfolio, and further growth in credit. This results in banks becoming cautious and restricting lending, thereby resulting in the credit contraction risk spilling over to the real sector of the economy which at that time needs credit the most. It may lead to systemic risk which may spiral into economic crisis. 0.4 The financial crisis which originated in 2007 was unlike some of the past crises in that it did not occur due to a crash in the stock market. It originated in the banking and the shadow banking sectors in the form of excessive credit growth. When the credit bubble burst, banks were saddled with huge losses and capital write-offs. Further, banks were also finding it difficult to raise additional capital from the market. These losses destabilised the banking sector and sparked a vicious circle, whereby problems in the financial system contributed to restricting lending to the real sector that then fed back on the banking sector. Such interactions of the banking sector with the real economy highlighted the importance of effects of pro-cyclicality of capital and provisioning requirements in banking sector. 0.5 The issue of pro-cyclicality of bank capital regulation, as shown in various studies1, dates back to Basel II or to some extent to Basel I days. Repullo and Saurina (2011) have underscored the impact of Basel II capital requirements on pro-cyclicality by showing that the bank capital regulation may amplify business cycle fluctuations2. This effect may be more pronounced during downturns, when banks find it difficult to raise additional capital, which results in restricted lending. 0.6 The issue of pro-cyclicality was discussed in the meeting of the G-20 in November 2008 and it was agreed to address pro-cyclicality in financial market regulations and supervisory systems. Five principles were set for reform of financial markets, one being on “enhancing sound regulation”. The G-20 instructed the International Monetary Fund (IMF), the Financial Stability Forum (FSF), later renamed the Financial Stability Board (FSB), and the Basel Committee on Banking Supervision (BCBS) to develop recommendations to mitigate pro-cyclicality, including the review of how valuation and leverage, bank capital, excessive compensation, and provisioning practices may exacerbate cyclical trends. This brought into focus creation of macro-prudential tools to deal with pro-cyclicality and create countercyclical provisioning3 and capital buffers to obviate systemic risk. 0.7 Looking at the need for development of macro-prudential tools to address pro-cyclicality, the Group of Central Bank Governors and Heads of Supervision (GHOS), the oversight body of the BCBS (or Basel Committee), envisaged introduction of a framework for countercyclical capital measures. Their press release dated September 7, 2009 included a commitment to introduce a framework for Countercyclical Capital Buffer (CCCB) over and above the minimum capital requirement. The December 2009 Consultative Document, “Strengthening the resilience of the banking sector”, set out the following four objectives to address the issue of pro-cyclicality:
Thereafter, the Basel Committee issued a consultative Document on Countercyclical Capital Buffer in July 2010 for comments and issued Guidance for national authorities operating countercyclical capital buffer as part of the Basel III package in December 2010. 0.8 The CCCB is a critical component of the Basel III framework. Though presently not many countries have issued the guidelines on implementation of the buffer in their respective jurisdictions, most countries are expected to adopt it in the coming years. The primary aim of the CCCB regime is to build up a buffer of capital which can be used to achieve the broader macro-prudential goal of restricting the banking sector from indiscriminate lending in the periods of excess credit growth that have often been associated with the building up of system-wide risk. 0.9 The CCCB regime endeavours to ensure that not only the individual banks remain solvent through a period of stress, but also that the banking sector has capital in hand to help maintain the flow of credit in the economy during economic downturns and periods of stress. Further, as capital is a more expensive form of funding, the stipulation regarding build-up of capital defences may have the additional benefit of moderating excessive credit growth when economic and financial conditions are buoyant. At the same time, during the period of excessive credit growth, the buffer may act as a moderator from the debtors’ perspective as it is likely to raise the cost of credit, and therefore, dampen its demand, and may help to lean against the build-up phase of the cycle in the first place. 0.10 Against this backdrop, the Reserve Bank of India (RBI) set up an Internal Working Group (IWG) under the Chairmanship of Shri B Mahapatra, Executive Director, RBI, to create a CCCB framework for banks in India. The Approach of the IWG 0.11 The Basel Committee, based on empirical evidence, has observed that excessive credit growth builds up system-wide risk and prescribed credit-to-GDP ratio as the starting reference point for implementation of CCCB. Credit-to-GDP ratio tends to rise during the period of economic boom and fall during the period of economic downturn. The difference of the credit-to-GDP ratio from its long-term trend, viz., credit-to-GDP gap (actual credit-to-GDP ratio less long term credit-to-GDP trend) indicates the build-up of excessive credit growth in an economy and system-wide risk as a precursor to the crisis. The CCCB should, therefore, be build up when the credit-to-GDP gap exceeds a defined threshold. 0.12 The CCCB, by being based on credit, has significant advantage over many of the other variables of appealing directly to the objective of the CCCB, which is to achieve the broader macro-prudential goal of protecting the banking sector during periods of excess credit growth. Incidentally, it may be mentioned that the Basel Committee recognizes that the credit-to-GDP gap may not always work in all jurisdictions at all times, and that the authorities may enunciate a set of principles for the buffer decision in a transparent way. Judgment coupled with proper communications is thus an integral part of the CCCB regime. Further, the CCCB guide should also be internationally consistent. 0.13 The IWG noted the guidance of the Basel Committee, and in its analysis, has endeavoured to enunciate principles that would work in conjunction with judgement so as to establish a sound framework for CCCB in India, as also to facilitate further decision-making in the setting of CCCB. 0.14 Keeping in view the ‘comply or explain’ framework of the Basel Committee, the IWG started with calculating the credit-to-GDP gap as prescribed by the Basel Committee for CCCB framework for India. The IWG was aware of the drawbacks of depending solely on credit-to-GDP gap for CCCB framework. In a structurally transforming economy with rapid upward mobility, growth in credit demand will expand faster than GDP growth for several reasons:
0.15 Hence, the resulting inferences from credit-to-GDP gap may be misleading as it will be difficult to identify what and how much is due to structural transformation and how much is due to excessive credit growth. However, as the structural transformation gets entrenched and is reflected in the evolving trend, the deviation from this new trend could still indicate the “unsustainable” part of the credit demand, which may be “excessive” and may require dampening. Triggering the CCCB too early out of excessive caution may involve sacrifice of growth. On the other hand, complacency and failure to trigger buffer decision may lead to build up of pressure. 0.16 Given this context, the IWG felt that instead of mechanically following the credit-to-GDP ratio and credit-to-GDP gap, the Basel framework may be tested in Indian conditions, and if required, suitable modifications be made to the framework. The IWG tried to dovetail the CCCB framework prescribed by the Basel Committee to Indian conditions, albeit with a caveat that the CCCB calibration is such that the credit growth required for an emerging market economy like India does not get choked. 0.17 The empirical exercise to identify the suitability of credit-to-GDP ratio required a sufficiently long time series data on both credit and GDP. This posed a challenge as data to carry out a comprehensive evaluation and backtesting was not readily available. Though a large number of components of aggregate credit are presently being captured by regulators/entities, a long term time series at quarterly frequency of the same is not available with them. 0.18 While determining the sources of credit, it was not possible to define credit in an all-encompassing way as long term time series of quarterly data on variables such as (i) loans by housing finance companies (HFCs), (ii) loans by Non-banking finance companies (NBFCs), (iii) issue of commercial paper, and (iv) issue of bonds by corporate sector, were not available at quarterly frequency from their respective sources. Therefore, the availability of reliable time series data for sufficient length of time became the criteria to decide whether a particular component of credit would be included in the definition of credit for the purpose of analyzing the suitability of credit-to-GDP ratio. For the purpose of present exercise, the IWG decided to use data on bank credit comprising credit by scheduled commercial banks (including regional rural banks) as such a time series of data was available for a long period, as far as mid-1990s. 0.19 In India, availability of GDP data at quarterly frequency is relatively recent, with official data available from 1996-97. However, similar time series was not available for some of the other variables used by the IWG in its analysis, such as Gross NPA (GNPA) growth, etc. Keeping in view the availability of quarterly time series data on major components of credit and GDP, as also, corresponding data for other variables, the IWG decided to use time series data for all the indicators to be used in the present exercise from March 2001. 0.20 Further, the GDP data also show substantial seasonal variation, which needed to be taken into account before computing the credit-to-GDP ratio. Therefore, the standard method of de-seasonalising the GDP data was used, and the resultant seasonally adjusted GDP was used for computation of credit-to-GDP ratio. 0.21 Calculation of credit-to-GDP gap requires estimation of long term trend of credit-to-GDP ratio. For this purpose, the Basel Committee has prescribed use of one sided Hodrick Prescott filter. Though, the IWG considered use of one-sided Hodrick-Prescott filter as suggested by the BCBS guidance paper, due to limitations of data availability, particularly the quarterly GDP (before 1996-97) and other related variables (before 2001-02), using one-sided filter was not feasible. The IWG recognized this as a limitation and decided to proceed with use of two-sided Hodrick-Prescott filter for the purpose of analysis. Issues and Recommendations The recommendations of the IWG preceded by briefs on the relevant issues are given below: Authority to operate the CCCB 0.22 The IWG noted that the authority to operate CCCB would require relevant and current supervisory and macroeconomic information. The CCCB decision may have implications for the conduct of monetary policy on one hand and supervision function on the other. The IWG felt that RBI would be better placed in conducting a detailed assessment of prevailing supervisory and macroeconomic information, as in India these functions and information is vested with itself. Recommendation 1 RBI shall be the authority to operate and communicate the CCCB decision. (Paragraph 3.10) Credit-to-GDP Gap Estimation 0.23 The analysis was carried out using credit-to-GDP gap to estimate the level where the CCCB may be triggered, i.e., the lower threshold (L). However, the IWG observed that using long term credit-to-GDP gap on its own, could not help in identification of the lower threshold of CCCB. The IWG felt that the likely reasons for inadequacy of credit-to-GDP gap as a sole factor may be because of India specific circumstances such as, the stage of economic development, the degree of maturity of financial markets, the institutional framework, the process of structural transformation underway, etc. Hence, the IWG deviated from the methodology prescribed by the Basel Committee considered it necessary to use data on growth in GNPA, along with the credit-to-GDP data to arrive at the thresholds. Recommendation 2 While the credit-to-GDP gap may be used for empirical analysis to facilitate CCCB decision, it may not be the only reference point in the CCCB framework for banks in India and the credit-to-GDP gap may be used in conjunction with other indicators like GNPA growth for CCCB decisions in India. (Paragraph 3.26) Pre-announcement of the CCCB 0.24 The IWG observed pro-cyclicality in the time series data on credit-to-GDP gap and the annual growth on GNPA of the banking industry in India. The relationship between credit-to-GDP gap and annual growth in GNPA was obtained, and it was observed that the credit-to-GDP gap leads GNPA growth, statistically significantly, by sufficient period with a peak statistical significant period of 9 quarters. Hence, given the lag identified by the analysis, the IWG felt that the CCCB should be triggered well before the expected increase in GNPA. Further, in line with the Basel Committee prescription, the CCCB decision may be pre-announced with a lead time of up to 12 months (4 quarters). Recommendation 3 The CCCB decision may be pre-announced with a lead time of 4 quarters. (Paragraph 3.33) Setting the Lower Threshold of the CCCB 0.25 The Basel Committee has prescribed the lower threshold (L) value for CCCB at 2 percentage points of the credit-to-GDP gap. To estimate the CCCB trigger threshold, the IWG used the method proposed by Sarel (1996). In the analysis, it was observed that when the credit-to-GDP gap reaches 3 percentage points, its relationship with GNPA became highly significant. Hence the CCCB trigger (lower threshold, L) for the Indian banking system may be when the credit-to-GDP gap reaches 3 percentage points provided the relationship with GNPA remains significant. Recommendation 4 The lower threshold (L) of the CCCB when the buffer is activated may be set at 3 percentage points of the credit-to-GDP gap, provided its relationship with GNPA remains significant. (Paragraph 3.35) Fixing of the Upper Threshold of the CCCB 0.26 The Basel Committee has prescribed higher threshold (H) value for CCCB at 10 percentage points of the credit-to-GDP gap. However, India being an emerging market economy, growth related concerns would warrant credit expansion that could not be compared with other countries, especially developed countries. Hence, in Indian context, the upper threshold of 10 percentage points of credit-to-GDP gap as prescribed by the Basel Committee was not found to be suitable by the IWG, as it felt that it may constrain the credit growth. 0.27 Looking at empirical evidence in the past decade, it was observed that the credit-to-GDP gap had exceeded 20 percentage points only in one quarter and even came close to that level only during two earlier quarters. Further it was observed that credit-to-GDP gap has immediately fallen sharply after each peak, due to combination of several factors, including the policy response. Average credit-to-GDP gap during a run of positive values from September 2005 to September 2009 works out to 11.56 percentage points. The credit GDP gap exceeded 15 percentage points only on four occasions. 0.28 The Basel Committee has observed that H should be low enough, so that the buffer would be at its maximum prior to major banking crises. Considering these factors, the IWG felt that a threshold value of 15 percentage points may be identified to deploy the maximum value of CCCB, in view of the rarity with which this threshold has been breached in the recent history. Recommendation 5 The upper threshold (H) of the CCCB may be kept at 15 percentage points of credit-to-GDP gap. (Paragraph 3.37) Calibration of CCCB 0.29 The IWG noted that the CCCB shall be activated when credit-to-GDP gap exceeds the lower threshold (3 percentage points) and shall be 2.5 per cent of risk weighted assets when it touches the upper threshold (15 percentage points). For any other value of the credit-to-GDP gap between 3 and 15 percentage points, the CCCB will vary linearly from 0 to 2.5 per cent of risk-weighted assets. Recommendation 6 The CCCB shall increase linearly from 0 to 2.5 per cent of the risk weighted assets (RWA) of the bank based on the position of credit-to-GDP gap between 3 percentage points and 15 percentage points. However, if the credit-to-GDP gap exceeds 15 percentage points, the buffer shall remain at 2.5 per cent of the RWA. If the credit-to-GDP gap is below 3 percentage points then there will not be any CCCB requirement. (Paragraph 3.38) Use of Supplementary Indicators 0.30 Basel Committee, in its guidance, has also recommended use of supplementary indicators in the CCCB decision making process such as various asset prices, funding spreads and CDS spreads, credit condition surveys, real GDP growth and data on the ability of non-financial entities to meet their debt obligations on a timely basis. 0.31 Looking at the limitations of the credit-to-GDP gap indicator in India, the IWG also considered other variables, including those suggested by the Basel Committee and their variants in the Indian context as possible supplementary indicators that may help in the CCCB decision. These included indicators that are relevant to our banking system, and others like housing prices, equity prices, funding spreads, credit condition surveys, real GDP growth, data on the ability of non-financial entities to meet their debt obligations on a timely basis, credit-deposit ratio, credit condition surveys, industrial outlook survey, aggregate real credit growth, banking sector profits and non-performing assets. The IWG was of the view that the demands of Indian economy and the dynamics in our domestic financial markets are different from that of other countries. Hence, instead of depending solely on one indicator, the decision on CCCB should be taken considering the dynamics of various supplementary indicators. Further, the analysis should also include the correlations that these supplementary indicators have with the GNPA growth. Some of the supplementary indicators found relevant by the IWG are as under: 0.31.1 Credit deposit (C-D) ratio has been an integral part of micro-prudential monitoring in India. While the absolute C-D ratio is a function of several factors, including the statutory requirements, such as CRR and SLR, incremental C-D ratio provides an insight into the possible over-heating of the credit market and use of alternate sources of funding by banks. Incremental C-D ratio for moving period (one year to three years) was analysed, and it was observed that three-year moving incremental C-D ratio was bearing high positive correlation with credit-to-GDP gap. Similarly, incremental C-D ratio for moving period of three-years exhibited high negative contemporaneous correlation with the GNPA growth. However, at a higher lag, the correlation became positive. Recommendation 7 The incremental C-D ratio for a moving period of three-years and its correlation with credit-to-GDP gap as also, with GNPA growth, may be used as a supplementary indicator for the CCCB decision. (Paragraph 4.15) 0.31.2 Industrial Outlook (IO) Survey, an opinion based forward looking survey covering selected public and private limited companies in the manufacturing sector, is being conducted on a quarterly basis by the Reserve Bank of India. Empirical evaluation of the assessment index computed from the IO Survey indicated that the index exhibited a strong negative correlation with the GNPA growth, implying higher GNPA growth if the index is low and vice versa. However, the relation between this index and credit-to-GDP gap could not provide any conclusive results to the IWG. Recommendation 8 Looking at the utility of the IO assessment index as an indicator of incipient NPA growth, it may be used along with GNPA growth as a supplementary indicator in CCCB decision. (Paragraph 4.20) 0.31.3 The IWG observed that the Reserve Bank of India has been tracking the financial performance of corporate sector. Consistent time series of the ratios and rates for a sample of about 2,000 companies are available since the financial year 2000-01. The IWG felt that of the various financial indicators, the interest coverage ratio may be of particular importance to assess the stress faced by the corporate sector. 0.31.4 On examining the relationship of the interest coverage ratio to GNPA growth, it was found that there is no contemporaneous correlation between these indicators. However, when the correlation between interest coverage ratio and credit-to-GDP gap is examined, it is seen that in the periods of high credit-to-GDP gap, the companies have comfortable interest coverage, thereby indicating healthy financial position. Looking at the high correlation of interest coverage ratio with credit-to-GDP gap, the IWG recommends its inclusion as one of the supplementary indicators to supplement the CCCB decision. Recommendation 9 The interest coverage ratio with credit-to-GDP gap may be used as a supplementary indicator for CCCB decision. (Paragraph 4.26) 0.31.5 In India, the housing price index is a relatively new concept. Presently, the Reserve Bank of India is compiling a quarterly House Price Index (HPI) for some of the bigger cities. National Housing Bank (NHB) is also compiling an index, viz., RESIDEX that comprises only residential housing sector. It is envisaged that the index may later be expanded to include commercial property and land also. As there were not many data points available in the index, and also, as these indices being in formative stage, these were not considered as supplementary indicators for the current exercise. 0.31.6 Further, the RBI has also been analyzing credit conditions in specific sectors of the economy through a quarterly Credit Condition Survey (CCS) since January-March 2010. In a scenario, when it is relatively easy to monitor the credit supply by banks, but no direct quantitative data is available on credit demand, this type of survey becomes useful. This is a forward-looking survey and seeks information on various aspects of credit, including developments in credit sector and causes thereof. However, as this survey is relatively recent with only two years’ quarterly data, it may not be possible to use the results of CCS immediately. The IWG felt that the data from CCS may be a very useful input for CCCB exercise and going forward, this index may also form a part of supplementary indicators for CCCB decision. Recommendation 10 In due course, indices like House Price Index / RESIDEX and Credit Condition Survey may also form a part of the supplementary indicators for CCCB decision. (Paragraph 4.6 & 4.28) .0.32 In the analysis, it was observed that supplementary indicators such as incremental C-D ratio and IO Survey Assessment index have a significant relationship with the GNPA growth. Further, the lag at which the relationship gets significant is more than 4 quarters (i.e. 12 months). This coincides with the IWG’s recommendation (Recommendation 3) on the period for pre-announcement of imposition of the CCCB. 0.33 The analysis of all the indicators on an ongoing basis will provide sufficient information inputs to the Reserve Bank of India to decide whether it is necessary to activate the CCCB. As the empirical evidence on the basis of any single indicator may not be conclusive, the IWG recommends that decision making in respect of CCCB may be similar to the multiple indicator approach, followed in policy making. In any case, the Basel Committee has provided ample freedom to the national authorities to “...apply judgment in the setting of the buffer in their jurisdiction after using the best information available to gauge the build-up of system-wide risk”. Recommendation 11 The Reserve Bank of India may apply discretion in terms of use of indicators while activating or adjusting the buffer. (Paragraph 4.34) Use of Sectoral Approach 0.34 Due to lack of availability of a long time series of a credible real estate index, the IWG could not use this critical indicator in the present exercise for CCCB implementation, but could only recommend it as a forward looking indicator. The IWG observed that looking at the level of development of market infrastructure in our country, as also, due to lack of availability of long time series of data, there may be some sectors (like real estate sector) that may be critical due to their bearing on financial stability, but may not be a part of CCCB decision. Credit growth to certain sensitive sectors may lead to formation of asset bubbles and also significantly outpace the overall credit growth. Excessive credit growth in specific sectors may have significant financial stability risks. 0.35 The RBI has been applying countercyclical capital and provisioning requirements based on the analysis of sectoral credit growth. In the build-up phase, the tightening of prudential requirements made credit to targeted sectors costlier thereby moderating the flow of credit to these sectors. There is evidence that moderation in credit flow to these sectors was also in part due to banks becoming cautious in lending to these sectors on the signalling effect of RBI’s perception of build up of sectoral risks. This way the exposure of banks’ to these sectors was reduced. Looking at such sector specific peculiarities in our country and their subsequent impact on implementation of macro-prudential policies, the IWG recommends that the CCCB framework in India may have to work in conjunction with sectoral approaches. Recommendation 12 The CCCB framework in India may be operated in conjunction with sectoral approach that has been successfully used in India over the period of time. (Paragraph 4.30) Release of CCCB 0.36 The Basel Committee had recommended that CCCB release may be required due to banking system related losses or due to systemic issues. To prevent the crisis from taking a large proportion, the release of buffer should be immediate. Basel Committee has suggested a few indicators to guide the authorities during the release phase of CCCB. However, these indicators do not provide conclusive evidence of their utility during such time. Hence, due to inherent uncertainty and the lack of experience associated with operating of CCCB, the IWG observed that the variables to be used to guide the release phase should be selected in such a way that they react sufficiently promptly. For the release phase, the same set of indicators that were used during the activating phase of the CCCB may be used. However, owing to inherent uncertainty and the lack of experience associated with operating of CCCB, the IWG felt that instead of hard rules-based approach, flexibility in terms of use of judgement and discretion may be required for operating the release phase of CCCB. 0.37 The IWG also agreed that gradual release of CCCB or even release in discrete time/amount of CCCB would not serve the basic purpose of CCCB. The IWG felt that in case of crisis in banking sector or any other sector indirectly impacting the banking sector, it is prudent to stem the crisis early, and hence, the entire CCCB may be released at a single point in time. Recommendation 13 The same set of indicators that are used for activating CCCB may be used to arrive at the decision for the release phase of the CCCB. However, instead of hard rules-based approach, flexibility in terms of use of judgement and discretion may be provided to the Reserve Bank of India for operating the release phase of CCCB. Further, the entire CCCB may be released promptly at a single point in time. (Paragraph 5.5 & 5.7) Treatment of surplus created after release of CCCB 0.38 When the CCCB returns to zero, the capital that is released is for the purpose of absorbing losses or for protecting banks against the impact of problems elsewhere in the financial system. In such a case, the Basel Committee had recommended that the capital surplus created should be unfettered and that there should be no restrictions on banks on distribution of this capital. However, the Basel Committee has left the final decision on treatment of this surplus with national authorities. 0.39 The IWG felt that unfettered access to capital by banks may not be prudent as the RBI may be required to prohibit certain use of the released buffer by banks if it feels that such an action is necessary given the prevailing circumstances. Recommendation 14 The capital surplus created when the countercyclical buffer is returned to zero should not be unfettered. The Reserve Bank of India would provide necessary guidance to the banks as regards treatment of the surplus at times when the CCCB returns to zero. (Paragraph 6.1) Jurisdictional Reciprocity 0.40 To ensure a level playing field among the domestic and foreign banks, the Basel Committee has recommended jurisdictional reciprocity. The IWG observed that in view of importance of CCCB implementation in India, global best practice as suggested by the Basel Committee may be implemented. Further, Reserve Bank of India has always ensured a level playing field for all the banks having presence in India. Banks in India (both domestic and foreign incorporated) will have to ensure that the CCCB requirement is calculated based on their exposures in India. Recommendation 15 (i) All banks operating in India (either foreign incorporated or domestic banks) should maintain capital under CCCB framework based on exposures in India. (ii) The RBI will convey the CCCB requirement to the home supervisor of the foreign incorporated banks so that they may ensure that their banks maintain adequate capital under CCCB as prescribed by the Reserve Bank of India. (iii) Banks incorporated in India having international presence have to maintain adequate capital under CCCB as prescribed and communicated by the host supervisors to the Reserve Bank of India. (vi) The RBI may also ask Indian banks to keep excess capital under CCCB framework in any of the host countries they are operating if it feels the CCCB requirement in host country is not adequate. In case the CCCB requirement in other jurisdiction is nil / insufficient, the Reserve Bank of India may require that the banks maintain higher buffers. (Paragraph 6.3) Communication of the CCCB Decision 0.41 The Basel Committee has noted that the buffer in each jurisdiction is likely to be used infrequently, and hence, instead of making quarterly statements on CCCB decision on an on-going basis, the authorities may comment on an annual basis. In India, CCCB decisions may form a part of the annual monetary policy statement of the Reserve Bank of India. However, more frequent communications can be conducted by the Reserve Bank of India, if there are sudden and significant changes in economic condition which may have an impact on CCCB decision. At the time of communicating CCCB decision, the Reserve Bank of India may disclose, at its discretion, the mechanics of the CCCB approach, the information that was used to arrive at the decision, etc. Recommendation 16 The CCCB decisions may form a part of the annual monetary policy statement of the Reserve Bank of India. However, more frequent communications can be made by the Reserve Bank of India, if there are sudden and significant changes in economic condition that may have an impact on CCCB decision. Further, at the time of communicating CCCB decision, the Reserve Bank of India may disclose, at its discretion, the mechanics of the CCCB approach, the information that was used to arrive at the decision, the time line of the CCCB activation, etc. (Paragraph 6.4 & 6.5) Interaction of CCCB with Pillar 1 and Pillar 2 0.42 The CCCB incorporates elements of both Pillar 1 and Pillar 2. It may not be desirable that the capital is held twice both under Pillar 1 and Pillar 2 requirements. Hence, prescription under Pillar 2 should not stipulate capital requirement to capture system-wide issues, if the bank is already maintain capital under CCCB framework. Further, the IWG also felt that the capital meeting the CCCB should not be permitted to be simultaneously used to meet non-system-wide elements (e.g. concentration risk) under Pillar 2 requirement. Recommendation 17 (i) A bank maintaining CCCB may not hold capital under Pillar 2 requirement for financial system-wide issues. (ii) The capital meeting the countercyclical buffer should not be permitted to be simultaneously used to meet non-system-wide elements of Pillar 2 requirement. (Paragraph 6.6) Location of the CCCB 0.43 The IWG noted that as in the case with the minimum capital requirement, host authorities would have the right to demand that the CCCB be held at the individual legal entity level or consolidated level within their jurisdiction. The IWG recommends that for all banks operating in India, CCCB shall be maintained in India. Recommendation 18 For all banks operating in India, CCCB shall be maintained on solo basis as well as on consolidated basis in India, where appropriate. (Paragraph 6.7) Periodic review 0.44 The IWG recognizes that CCCB is a new concept and is untested. Further, it is also likely that it may not be imposed frequently. The indicators and thresholds used by the IWG may either show more robust results in due course of time or may even breakdown. Moreover, there is possibility of emergence of new indicators. Therefore, continuous research and empirical testing may be required and the indicators suggested in recommendation 9 such as House Price Index, RESIDEX, Credit Condition Survey, etc., should be further explored. Recommendation 19 The indicators and thresholds used for CCCB decisions may be subject to continuous research and empirical testing for their usefulness and new indicators may be explored to support CCCB decisions. (Paragraph 6.8) Introduction 1.1 The recent global financial crisis has underscored the importance of capital in build-up of defence against the vicissitudes of financial system and the economic cycles. This aspect attains prime importance as during the crisis, it was observed that arranging of capital became extremely expensive and difficult. It brought forth the fact that shoring up of capital during the period of excess credit growth serves a dual advantage – on one hand, it helps moderate excessive credit growth when economic and financial conditions are buoyant, and on the other, it provides comfort in terms of additional capital that may be available at times of crises. 1.2 Business entities are generally exposed to economic cycles. In boom times, when there is an economic upswing, demand for their products and services grows exponentially. They do well in their businesses, increase borrowing, create more capacity and make high profits as a result of increased leverage. However, when economic conditions deteriorate, demand for goods and services falls. Business shrinks and entities that are unable to service their loans and liabilities default in meeting their obligations. 1.3 Banking business is no exception to this; rather banks are more prone to economic cycles. Pro-cyclicality, in banking business accentuates the ill-impacts of economic cycles in a feedback loop, i.e., the cycle becomes self-fulfilling, increasing in size and causing externalities to the economy and society. 1.4 In boom times, there is more demand for credit and banks become aggressive, thereby relaxing the credit standards and indulging in excessive credit growth. Debtors do well and service the loans in time. Debtors also improve their financials as also their credit ratings. Banks loan loss ratios are below their long-run average and need for loan loss provisions is less. Banks make good profits as the loan loss provisions are low. Banks also do not need more capital as their borrowers have good credit ratings and as per Basel Capital requirements, high rated borrowers require less capital. 1.5 When the economic cycle turns, borrowers’ credit quality tends to worsen, leading to a higher probability of default in servicing interest and principal payment. Some of these loans become non-performing assets (NPAs). Banks’ profits start dipping or they may even start making losses thereby resulting in write-off of capital. At the same time, they are required to make higher loan loss provisions for the non-performing loans and maintain higher capital for the rating down-gradation of their borrowers. With their poor financials, banks do not get external capital to support their loan portfolio. This results in banks becoming cautious and restricting lending, thereby resulting in the risk spilling over to the real sector of the economy which needs credit the most. It may cause further spiralling in systemic risk and may lead to economic crisis. 1.6 The issue of pro-cyclicality of bank capital regulation, as shown in various studies4, dates back to Basel II or to some extent to Basel I days. Repullo and Saurina (2011) have underscored the impact of Basel II capital requirements on pro-cyclicality by showing that the bank capital regulation may amplify business cycle fluctuations5. This effect may be more pronounced during downturns, when banks find it difficult to raise additional capital, thereby restricting their lending. Hence, mitigation of the pro-cyclicality of minimum capital requirements is an issue that is engaging the policy makers. 1.7 The G-20, aware of the problem of pro-cyclicality in the capital regulation framework, in its meeting in November 2008, agreed that it was important to address the issue of pro-cyclicality in financial market regulations and supervisory systems. They set five principles for reform of financial markets, of which one was “enhancing sound regulation”. 1.8 The G-20 asked the International Monetary Fund (IMF), the Financial Stability Forum (FSF), later renamed the Financial Stability Board (FSB), and the Basel Committee on Banking Supervision (BCBS) to develop recommendations to mitigate pro-cyclicality, including review how valuation and leverage, bank capital, excessive compensation, and provisioning practices may exacerbate cyclical trends. 1.9 Looking at the need for development of tools to address the cyclicality in capital requirement, the Group of Central Bank Governors and Heads of Supervision (GHOS), the overseeing body of the standards set by the Basel Committee, envisaged introduction of a framework on countercyclical capital measures. Their press release dated September 7, 2009 included a commitment to introduce a framework for Countercyclical Capital Buffer (CCCB) above the minimum capital requirement. 1.10 In its consultative document for strengthening the resilience of the banking sector6, the BCBS (hereafter referred to as Basel Committee) stressed on the need for “…dampening any excess cyclicality of the minimum capital requirement …” as also, “…to achieve the broader macro-prudential goal of protecting the banking sector from periods of excess credit growth …”. For achieving the latter objective, a Macro Variables Task Force (MVTF) was constituted by the Basel Committee. 1.11 The MVTF placed a fully detailed proposal for review by the Basel Committee at its July 2010 meeting7. Thereafter, in December 2010, the Basel Committee released a guidance document (Guidance for national authorities operating the countercyclical capital buffer, December 2010) providing guidance to national authorities in implementing the countercyclical capital buffer, which in addition, was also likely to help banks understand and anticipate the CCCB decisions in the jurisdictions to which they have credit exposures. 1.12 The Basel Committee, based on empirical evidence, has observed that excessive credit growth builds up system wide risk and prescribed credit-to-GDP ratio as the starting reference point for implementing CCCB. Credit-to-GDP ratio tends to rise in economic boom periods and fall during economic busts. The deviation of the credit to GDP ratio from its long term trend (the credit-to-GDP ratio gap) indicates the build up of excessive credit growth in an economy and system wide risk as a precursor to a crisis. The CCCB should, therefore, be built up when the gap of credit-to-GDP ratio vis-à-vis its long term trend exceeds a certain threshold. 1.13 In this backdrop, the Reserve Bank of India (RBI) set up an Internal Working Group (IWG) on countercyclical capital buffer under the Chairmanship of Shri B Mahapatra, Executive Director. The constitution of the Group was as follows:
1.14 The broad terms of reference of the IWG are as under:
1.15 The IWG places on record, its appreciation for Shri Anirban Basu, AGM, DBOD, RBI for coordinating the data collection, preparing background material and providing various inputs to the IWG. The IWG also acknowledges the excellent support provided by Shri Bhaskar Birajdar, Assistant Adviser, DSIM, RBI in carrying out the empirical work. 1.16 The Report is organized as follows. Chapter 2 reviews the theoretical underpinnings of the countercyclical capital buffer, detailing the Basel Committee recommendations and guidance and provides a backdrop to the subsequent chapters. Chapter 3 highlights the role of credit-to-GDP gap in Indian context. Chapter 4 enumerates the role of supplementary indicators in the CCCB framework. Chapter 5 talks about the release phase of the CCCB. Chapter 6 discusses other issues that are relevant to CCCB framework in India. The Report also has two annexes. Annex I details an illustrative mechanism to calculate the CCCB. Annex II illustrates calculation methodology of bank specific buffers. Major Recommendations of the Basel Committee 2.1 One of the key take-aways from the recent global financial crisis was the importance of cyclicality of the capital charge. During the time of economic downturn, where on one hand, there is erosion in bank’s equity due to write-offs and downgrading of many borrowers, on the other there is an increased demand to arrange for additional capital to maintain credit flow. Further, it has been observed that during such times, arranging for fresh capital is not only expensive but extremely difficult. 2.2 In this backdrop, a need was felt to develop tools to address the pro-cyclicality in capital requirement and consequently, the Group of Central Bank Governors and Heads of Supervision (GHOS) decided to introduce a framework for Countercyclical Capital Buffer (CCCB) above the minimum regulatory capital requirement. 2.3 Thereafter, in its consultative document on strengthening the resilience of the banking sector, the Basel Committee stressed on the need for “dampening any excess cyclicality of the minimum capital requirement” as also, “to achieve the broader macro-prudential goal of protecting the banking sector from periods of excess credit growth”. For achieving these objectives, based on the proposals of the Macro Variables Task Force (MVTF), the Basel Committee, in December 2010, released a document to provide national authorities operating the CCCB, guidance in implementing the CCCB decision. The document is also likely to help banks understand and anticipate the CCCB decisions in the jurisdictions to which they have credit exposures. 2.4 The CCCB envisages consistency in capital maintained by the banking sector with the macro-financial environment in which the banks operate. During times of excessive credit growth that lead to a build-up of system-wide risk, this buffer acts as an important macro-prudential tool with the regulator that can be deployed to ensure that the banking system accumulates sufficient capital to protect itself against future potential losses. Looking at the global experience, it is observed that the credit cycles are long (generally 10-12 years), and hence, it is highly unlikely that the CCCB may be operated frequently. As mentioned in the Basel Committee’s consultative document on CCCB, “…This focus on excess aggregate credit growth means that jurisdictions are likely to only need to deploy the buffer on an infrequent basis, perhaps as infrequently as once every 10 to 20 years”. 2.5 The CCCB regime ensures that not only do the individual banks remain solvent through a period of stress, but also provides a safeguard to the banking sector during such periods in the form of additional capital on hand to help maintain the flow of credit in the economy without its solvency being questioned. Further, as an additional benefit, during a period of excessive credit growth, the CCCB may act as a moderator as it is likely to raise the cost of credit, and therefore, dampen its demand. It is important to mention here that though the CCCB is a macro-prudential tool available with the regulator, the Basel Committee had not envisaged it as an instrument to manage economic cycles or asset prices, which can be best addressed through fiscal, monetary and other public policy actions. Having said that, it may also be mentioned that operation of the CCCB has implications for the conduct of monetary and fiscal policies. 2.6 The Basel Committee enunciated a few principles to guide national authorities in the CCCB framework. 2.6.1 Principle 1: (Objectives) Buffer decisions should be guided by the objectives to be achieved by the buffer, namely to protect the banking system against potential future losses when excess credit growth is associated with an increase in system-wide risk. 2.6.2 Principle 2: (Common reference guide) The credit-to-GDP gap is a useful common reference point in taking buffer decisions. It does not need to play a dominant role in the information used by authorities to take and explain buffer decisions. Authorities should explain the information used, and how it is taken into account in formulating buffer decisions. 2.6.3 Principle 3: (Risk of misleading signals) Assessments of the information contained in the credit to GDP gap and any other guides8 should be mindful of the behaviour of the factors that can lead them to give misleading signals. 2.6.4 Principle 4: (Prompt release) Promptly releasing the buffer in times of stress can help to reduce the risk of the supply of credit being constrained by regulatory capital requirements. 2.6.5 Principle 5: (Other macro-prudential tools) The buffer is an important instrument in a suite of macroprudential tools at the disposal of the authorities. Countercyclical Capital Buffer indicators 2.7 For developing a CCCB framework, Basel Committee has recommended a common reference guide based on the credit-to-GDP gap9. The Basel Committee has empirically tested and observed that across time and over a cross section of countries (including both developed countries and emerging countries) this ratio would have been a useful indicator of the build-up of system-wide risk in the past. The regulators have also been provided flexibility to calibrate the CCCB in a way that meets the requirement of their jurisdictions. Moreover, instead of depending totally on one indicator, the Basel Committee has suggested a few supplementary indicators that may be used in conjunction with the credit-to-GDP gap. However, for the CCCB decision, the regulators are expected to apply judgement after using the best information available to gauge the build-up of system-wide risk. The subsequent paragraphs cover the various indicators that may be used while calibrating the CCCB. A. Credit-to-GDP gap 2.8 The Basel Committee, based on empirical evidence, has prescribed credit-to-GDP gap as a useful starting reference point for implementing the CCCB. Intuitively, this indicator seems to have an inherent advantage as it is based on credit which aligns with the broader macro-prudential goal of CCCB, viz., protecting the banking sector from periods of excessive credit growth. In addition to credit-to-GDP gap, authorities in each jurisdiction may use other variables and qualitative information which they feel is useful for purposes of assessing the sustainability of credit growth and the level of system-wide risk, and also in taking and explaining CCCB decisions. The authorities may also use various other macro prudential tools available with them, as also sectoral measures to protect the economy from excessive credit growth. 2.9 The BCBS paper10 has outlined an extensive analysis of the properties of credit-to-GDP gap and other variables. The credit-to-GDP gap was the best performing amongst these variables. The reasons cited in the paper are as under: “ … Second, credit related variables perform very well. In particular, the credit-to-GDP ratio tends to rise smoothly well above trend before the most serious episodes. The specification of the credit-to-GDP gap has a number of advantages over credit growth. Being expressed as a ratio to GDP, the indicator variable is normalised by the size of the economy. This means it is not influenced by the normal cyclical patterns of credit demand. Being measured as a deviation from its long-term trend, the credit-to-GDP gap allows for the well-known secular financial deepening trend. Being a ratio of levels, it is smoother than a variable calculated as differences in levels, such as credit growth, and minimises spurious volatility (no large quarter-to-quarter swings). …” 2.10 The prescribed CCCB guide has used a broad definition of credit that would capture all sources of debt used by the private sector to calculate a starting CCCB guide. This broad definition of credit endeavours to capture all sources of finances availed by the private sector. The data should include all credit extended to households and other non-financial private entities in an economy (credit extended by domestic and international banks as well as non-bank financial institutions), outstanding debt securities issued domestically or internationally to fund households and other non-financial private entities (corporate bonds). This would also include securities held by banks and other financial institutions in their trading portfolios and banking books as well as securities held by other residents and non-residents. 2.11 The guidance note also allows flexibility to the jurisdictions that do not have credit aggregates in terms of allowing them to initially use the broad aggregates available and widen the coverage of credit in the future. Supplementary indicators 2.12 Presently, not many countries have evolved CCCB framework, so there is no unanimity on an alternative indicator11 that may substitute credit-to-GDP ratio as the primary indicator in the CCCB decision. However, there are some studies carried out in this area that have questioned the appropriateness of the credit-to-GDP gap. Even the BCBS guidance document, while advocating credit-to-GDP indicator as the common reference point in taking CCCB decisions, cautioned that “... (Risk of misleading signals) Assessments of the information contained in the credit/GDP guide and any other guides should be mindful of the behaviour of the factors that can lead them to give misleading signals”. 2.13 In using the credit-to-GDP ratio, any reduction in denominator, say, purely due to a cyclical slowdown or outright decline in GDP may inflate the ratio indicating build-up of system-wide risks. Further, the long term average of credit-to-GDP ratio may not accurately capture the turning points and hence, CCCB decision may require other indicators, as also judgement of the national authorities. Also, in their criticism of the credit-to-GDP guide, Repullo and Saurina12 have said that there is empirical regularity that credit usually lags the business cycle. In particular, in downturns, the credit-to-GDP ratio continues to be high due to greater credit demand by households and firms (making use of credit lines, partly to finance inventory accumulation) and a slower, sometimes even negative, GDP growth. Also, the use of deviations of the credit-to-GDP ratio with respect to its trend compounds the problem, because it takes some time before the ratio crosses the trend line. It is also felt that a micro-oriented supervisor concerned about bank failures would naturally be averse to reducing capital requirements in a downturn. Even if the national authorities decide to release the CCCB due to the worsening of economic conditions, financial markets might react very negatively to such a decision to release the CCCB. 2.14 Though there are limitations of credit-to-GDP gap that have been cited in some literature, these are more of country specific observations. Of course, literature that supports the credit-to-GDP gap is also available in public domain. More importantly, apart from using credit-to-GDP indicator, the guidance document has suggested use of some supplementary indicators that may be used by the national authorities to assess the consistency of the inferences derived from the credit-to-GDP gap. The following paragraphs list some of the supplementary indicators that may be considered during the CCCB decision. B. Various asset prices 2.15 Different variables that could be used as indicators for the CCCB were considered by Drehmann et al (2011). Asset prices including financial assets and property prices are the two categories of assets that may be used as a proxy for market risk as these show exceptionally strong growth in periods that precede systemic banking events. 2.16 Asset price and credit extension are closely related. Easy credit lowers the rate of interest thereby increasing the present value of the discounted stream of cash flow from the asset, which may result in appreciation in its price. Further, higher asset price may result in higher credit off-take considering the fact that the asset may be used as collateral. Hence, this may be a useful indicator to assist national authorities during CCCB build-up phase. However, as the deviations from the long-term trend may tend to narrow prior to the emergence of financial strains, this may not serve as a useful indicator during release phase as the authorities may start releasing the CCCB too early. C. Funding spreads and CDS spreads 2.17 The spreads are indicators of build-up of stress/vulnerability in the system. Various spreads that may be considered include: 2.17.1 Banking sector credit spreads - Credit spreads indicated by the CDS spreads of various banks or an index, are an important source of information on the build-up of vulnerabilities in the banking sector (in the sense of the market assessment of the risk of bank failures). Of the two, indices of credit spreads are more reliable than single name CDS as it is possible to manipulate single name CDS of banks. However, it was observed during the recent financial crisis that the CDS market tends to freeze during a severe downturn / recession and hence, this indicator may have limited utility during such periods. 2.17.2 Cost of liquidity – The impact of funding liquidity on health and functioning of the banks was well evident during the recent crisis. Cost of liquidity is an indicator of the aggregate funding conditions in markets. It is the average cost that the banking sector has to pay to raise short-term liquidity. Liquidity strains are visible during the times of crises, and may provide useful inputs during the transition from good to bad times. Of course, such cost is modulated by presence of the monetary authority, especially, during times of stress. The cost of liquidity may be proxied by market based spread such as LIBOR-OIS spread, though it is important to note from recent experience that LIBOR, being a polled rate, is subject to manipulation. 2.17.3 Corporate bond spreads - This is an indicator of credit quality for the economy. The spreads also indicate the levels of credit risk and higher spreads are representative of stressed periods and vice-versa. Spreads can also be viewed as indicators of the average cost of borrowing in the economy, including banks, and thus be used in a tool that targets the smoothing of funding costs. D. Credit condition surveys 2.18 Credit conditions survey, or senior loan officers’ survey, as it is known in many countries, provides valuable inputs on the emerging conditions in the credit market demand directly from the officers dealing with the loan proposals at the commercial banks. Loan demand from different sectors of the economy is captured through these surveys, which provides the otherwise uncovered portion of the market condition. 2.19 When used in conjunction with actual credit data and the other information such as industrial outlook surveys, and corporate sector profitability, the combined information set is rich enough to provide a judgment about the present status of the credit market and the borrowers, and its likely direction in the near future. E. Real GDP growth 2.20 One of the most important objectives of the CCCB proposals is to smoothen the business cycle (Drehmann et al, 2011). The natural indicator for assessing the overheating of the economy is the above-trend growth in real GDP. Rapullo and Saurina (2011) argue that real GDP growth would be an important indicator for assessing the requirement of CCCB. 2.21 However, there are counter-arguments which suggest that the business cycles and credit cycles are not necessarily coincidental. According to Koopman and Lucas (2005), the frequency of a typical business cycle is 4-8 years, while credit cycles have much longer durations. These arguments show that the real GDP growth may not be an ideal indicator for prescription of CCCB. 2.22 Nevertheless, the contribution of robust real GDP growth on likely stress on the banks cannot be under-estimated. Therefore, while the real GDP growth may not serve as a primary indicator for CCCB activation, it should form part of the information set which is considered by the authorities for making the CCCB decisions. F. Data on the ability of non-financial entities to meet their debt obligations on a timely basis 2.23 The corporate sector’s inability to repay its debt liabilities may be an indicator of the problems associated with economic downturn and may adversely impact the banks. Therefore, a measure of corporate sector’s debt servicing ability is an important indicator for any CCCB decision. The interest coverage ratio (ratio of interest payments to EBIDTA) is a good candidate variable for this purpose. However, the main drawback of this indicator in its raw form is that it is greatly influenced by the market interest rates. In a high interest rate scenario which could itself be due to counter-cyclical monetary policy measures, this ratio would deteriorate, indicating the growing stress in the corporate sector. This being the result of a conscious policy measure could not possibly be taken as an input. However, this may be a useful indicator, if the stress can be evident even after accounting for the impact of monetary policy. G. Aggregate real credit growth 2.24 This is a useful indicator as during periods of high growth, there is a rapid credit expansion, whereas during times of stress, credit off-take declines. This measure would include credit from all sources including banks. H. Banking sector profits 2.25 Banking sector profits are high in good times and lower during the times of stress. This indicator may provide useful inputs to help identify build-up / release of stress in the system. However, the performance of bank (pre-tax) profits as a signal for the build-up in good times appears to be somewhat uneven. The variable worked very well for the United States and United Kingdom during the current crisis as also for Spain in the early 1990s. However, it performed poorly otherwise, e.g., in the more recent experience in Spain. Incidentally, this could have been due in part to changes in accounting practices, including the introduction of dynamic provisioning (Drehmann et al, 2011). I. Non-Performing Assets 2.26 Non-Performing Assets (NPAs) are closely related to the economic cycles and are accentuated during periods of stress. In fact, the cycle is frequently identified by the rise and fall of the realised losses. This indicator is useful to assess the transition from good period to periods of stress. However, it may not be a useful indicator during building up of buffers in good times, as it will not differentiate between the intensity of the good times, and may lead to significantly higher buffers. However, NPA build-up may provide useful inputs to calibrate the CCCB decision in the release phase of the CCCB. Determining threshold 2.27 The efficacy of the CCCB decision depends upon calibration of the threshold levels of the credit-to-GDP gap, so as to meet the objective of the CCCB. While calibrating, the authorities have to ensure that on one hand, the banking system should be protected from periods of excess credit growth, while on the other, to make capital available to the banking system during period of stress. The Basel Committee has recommended two threshold levels of the credit-to-GDP gap - lower threshold level, L, when the capital buffers build-up should be activated and the upper threshold, H, which is the level at which the CCCB attains maximum value. The decision to implement a different CCCB add-on than indicated by the Basel Committee guide has been left in the hands of national authorities, subject to providing a public and transparent explanation of the decision. 2.28 The Basel Committee recommended that the minimum threshold (L), when the guide would start to indicate a need to build up capital, should be low enough, so that the banks get adequate time for the same. Further, as the banks are to be given one year to raise additional capital, there is likelihood that the indicator may breach the minimum threshold at least 2-3 years prior to a crisis. However, ‘L’ should be high enough, so that during normal times, it should not indicate additional capital requirement. 2.29 As regards maximum threshold level, ‘H’, beyond which no additional capital would be required, even if the gap continues to increase, the Basel Committee has recommended that it should be low enough, so that the banks operate at maximum CCCB i.e., 2.50 per cent of risk-weighted assets prior to major banking crises. 2.30 After empirical studies across various countries, the Basel Committee has recommended values of ‘L’ and ‘H’ to be 2 percentage points and 10 percentage points, respectively, with an objective to build up buffers a few years ahead of crisis and no CCCB requirement during normal times when the gap is mostly zero. The Basel Committee also observed that “L=2 and H=10 provide a very robust trade-off between type 1 errors (a crisis occurs but the gap does not breach the threshold) and type 2 errors (the threshold is breached but no crisis occurs)”. 2.31 For any other value of the credit-to-GDP gap between 2 and 10 percentage points, the Basel Committee has recommended that the CCCB will vary linearly between 0 and 2.5 per cent of risk-weighted assets. Performance of variables for signalling release of the CCCB 2.32 The release of the CCCB may be warranted under typical circumstances where either there are losses in the banking system or there are systemic issues. In the case of the former, the CCCB may be released so that it is used for absorbing the losses before the banks begin depleting their normal capital conservation buffers. In the case of the latter where problems elsewhere in the financial system are causing disruption to the flow of credit, thereby impacting the growth adversely, the release of CCCB should be immediate to stem the crisis from impacting the banking system and resultant losses therein. It is therefore essential that variables guiding the release phase react promptly. 2.33 The Basel Committee observed that macro variables may not be ideal indicator variables for signalling the release phase. It also mentions that indicators of banking sector conditions such as aggregate profits, non-performing loans, etc. provide mixed signals for the release phase. Though asset prices are useful indicators as their frequency of availability is higher than quarterly macro data or information from bank balance sheets (which may only be available annually in some cases), these may actually result in releasing the CCCB too early. However, these are useful in explaining the need to release the CCCB after the financial system comes under stress. 2.34 Spreads such as CDS spreads, funding cost, etc., can emerge as alternative market based indicators especially as they were able to capture the onset of the recent crisis. In any case, corporate credit spreads may not be considered as a useful indicator as their correlation with systemic banking crises is yet to be established. The historical evidence for the TED spreads is also ambiguous. Treatment of surplus when CCCB returns to zero 2.35 As per the BCBS recommendations, when the CCCB is turned off, the capital surplus created should be unfettered, i.e., there should be no restrictions on distribution of this surplus. In the situation when the CCCB is made zero, banks may prefer to use this capital to absorb losses or protect themselves against the impact of problems elsewhere in the financial system. However, the final decision on the use of this surplus rests with national authorities. Jurisdictional reciprocity 2.36 The Basel Committee has observed that jurisdictional reciprocity in CCCB framework would ensure level playing field between domestic and foreign banks in a jurisdiction. Jurisdictional reciprocity entails that capital requirement under CCCB framework should be based on the exposures pertaining to the host jurisdiction. However, the power to set and enforce CCCB will ultimately rest with the home authority. 2.37 The host jurisdiction should ensure that all the banks operating in its jurisdiction (whether locally incorporated or incorporated in a foreign jurisdiction) are meeting the CCCB requirements for all the exposures in that jurisdiction. It should also be communicated to the supervisor of the home jurisdiction of the foreign incorporated banks so that such banks can be supervised for adequacy of CCCB by their home supervisors also. 2.38 However, if it is felt that the CCCB requirement of a host jurisdiction is inadequate, the home jurisdiction may impose higher CCCB requirement for the banks they supervise. Moreover, it is also important that the home supervisor should not stipulate lower CCCB requirement for its banks operating in the host jurisdiction as it may distort the level playing field between the domestic and foreign banks in host jurisdiction. Further, it may also discourage implementation of CCCB. In case the host jurisdiction does not have CCCB requirements, the home jurisdiction may stipulate CCCB requirements for exposure of its banks in that jurisdiction, based on the available relevant data. Frequency of buffer decisions and communications 2.39 The Basel Committee has recommended that the CCCB decision be pre-announced with a lead time of upto 12 months so as to give banks a reasonable amount of time to adjust their capital plans. 2.40 The Basel Committee observed that as the CCCB in each jurisdiction is likely to be used infrequently, instead of making quarterly statements on buffer decision on an on-going basis, the authorities may comment at least on an annual basis. More frequent communications may be conducted, when any action on implementation of CCCB is taken or when there are significant changes to the authorities’ outlook for the prospect of changes to CCCB settings. Interaction with Pillar 1 and 2 2.41 The CCCB incorporates elements of both Pillar 1 and Pillar 2. Like Pillar 1 approach, CCCB has pre-determined rules and disclosure requirements. It is akin to Pillar 1 approach in that it is a framework consisting of a set of mandatory rules and disclosure requirements. But CCCB also incorporates judgement and discretion in setting buffer levels, as also, in terms of explanation by authorities on CCCB actions. 2.42 As far as capital for Pillar 2 is concerned, the Basel Committee observed that Pillar 2 capital requirements capture additional risks that are not related to system-wide issues. Hence, capital required for the CCCB should not be allowed to be used for such other risk elements under Pillar 2. Location of the CCCB 2.43 Host authorities would have the right to demand that the CCCB be held at the individual legal entity level or consolidated level within their jurisdiction. If they do not exercise that right, the home authorities of the consolidated parent must ensure that the CCCB is held at the consolidated parent level. Selecting the authority to operate the CCCB 2.44 The Basel Committee noted that CCCB will have implications for the conduct of monetary and fiscal policies, as well as banking supervision and hence, for CCCB decision, the most critical inputs shall be the prevailing supervisory and macroeconomic information. Due to such variations in the institutional arrangements across various jurisdictions, the issue of relevant authority to operate the CCCB has been left to the discretion of each jurisdiction by the Basel Committee. Empirical Work for CCCB Framework for India 3.1 India’s financial system has been dominated by banks which are the main channel for providing credit to the economy. Whenever the Reserve Bank of India considers increased likelihood of build-up of asset bubble, monetary policy has been the major instrument in tempering the credit growth (Gopinath, 2010 and Sinha, 2011). In the past, the conduct of macro-prudential policies and deployment of sectoral risk weights, etc., were largely based on aggregate credit growth and incremental credit–deposit ratio used with policy makers’ judgment, rather than disaggregated statistical analysis (Gopinath, 2010). The sectoral approach adopted in India towards counter-cyclical policies has stood the test of time and the RBI has indicated its preference to continue the same on several occasions (Subbarao, 2010). 3.2 However, in India, the utility of aggregate credit to indicate systemic risk build-up has its own limitations. This is due to the fact that credit growth in India, unlike in advanced countries, could be reflective of several factors that may include initiatives like flow of credit to priority sectors like agriculture, small and medium enterprises, financial inclusion and the resulting financial deepening, rising efficiencies of the credit market, etc. (Chakraborty, 2011). These factors are likely to result in structural shift in credit-to-GDP ratio. 3.3 The structural shift in the credit-to-GDP ratio has been observed and taken into account while choosing the sample period for the study conducted by the IWG. However, the changes in the credit-to-GDP ratio have been taking place gradually as the economy is absorbing the policy changes and adapting to the financial deepening. Moreover, excessive credit growth, which is beyond the absorptive capacity of the productive sectors, has always been seen with circumspection by the Reserve Bank of India. Such instances have prompted the Reserve Bank of India to activate the counter-cyclical policies, albeit at a sectoral level. 3.4 Such sector specific approaches may be necessary to tackle the build-up of credit to a particular sector. However, it is likely that the overall credit growth may at times exceed the genuine demand for investment that may result in undesirable outcomes. These outcomes could be in the form of build-up of systemic risk. 3.5 Hence, any increase in overall credit growth beyond its long term trend may have to be addressed with counter-cyclical policies prescribed by the Basel Committee in the form of various prescriptions, including CCCB. In other words, looking at our country specific requirements, CCCB may have to work in conjunction with sectoral approaches. 3.6 The IWG had to ensure that the CCCB calibration is such that the credit growth does not get choked. Also, the IWG felt that the Basel framework needed to be tested in Indian conditions, and if required, suitable modifications may be made to the framework. In its analysis, the IWG has tried to dovetail the CCCB framework prescribed by the Basel Committee to Indian conditions. 3.7 In this context, it may be mentioned that the Basel Committee’s framework of “comply or explain” provides freedom to the national authorities to deviate from the standard prescriptions of the Committee. But in case a jurisdiction chooses to “explain” the deviation from the given framework, the uncertainty of perception of the markets and international community about the explanation provided by the national authorities poses a major challenge for the authorities (Subbarao, 2011 and Sinha, 2011). 3.8 The Basel Committee, based on empirical evidence, has prescribed credit-to-GDP gap as a useful starting reference point for implementation of the CCCB decision. Furthermore, by being based on credit, it has the significant advantage over many of the other variables of appealing directly to the objective of the countercyclical capital buffer, which is to achieve the broader macro-prudential goal of protecting the banking sector from periods of excess credit growth. 3.9 The Basel Committee recognizes the fact that the credit-to-GDP gap may not always work in all jurisdictions at all times. However, for evolving the CCCB framework, it is expected that the national authorities would be transparent. 3.10 On the issue of the authority that will operate CCCB, the Basel Committee has left the discretion to respective jurisdictions. The IWG noted that the relevant authority to operate CCCB would require relevant and current supervisory and macroeconomic information. The CCCB decision will have implications for the conduct of monetary policy on one hand and supervision function on the other. The IWG felt that RBI would be better placed in conducting a detailed assessment of prevailing supervisory and macroeconomic information, as in India, these functions and information are vested with the RBI. The IWG recommends that the RBI shall be the authority to operate and communicate the CCCB decision. 3.11 Though the CCCB is to be applied only to the banks, the definition of credit used for operating the CCCB decision is broad based and comprises credit from all sources including foreign sources. The IWG carried out the empirical work to determine the possible indicators which could be used for CCCB decision by the Reserve Bank of India. Coverage of Credit 3.12 Financial resources to commercial sector are available from various sources, in the form of credit or equity. The following table (Table-1) lists not only credit flows but different sources of credit and also equity flows to the commercial sector. 3.13 While it is recognized that a wide definition of credit would be ideal for the empirical exercise, the availability of long time series is necessary to identify the suitability of the indicators for CCCB decisions. Given that the GDP data is available at quarterly frequency, the IWG decided to use the same frequency for other data sets also. Further, the IWG felt that availability of reliable time series data for sufficient length of time may determine whether a particular component of credit or indicator would be used for analysis. 3.14 In its analysis, the IWG perused publicly available data on various components of credit. However, it was observed that long time series of data at quarterly frequency were not available from their respective sources for some of the variables, viz., (i) loans by housing finance companies (HFC), (ii) loans by Non-bank finance companies (NBFC), (iii) issue of commercial paper (CP), and (iv) issue of bonds by corporate sector. 3.15 Further, the components, viz., (i) debt papers issued by corporates, and (ii) credit from foreign sources, i.e., external commercial borrowings and foreign currency convertible bonds were not available for sufficiently long historical period, on a consistent basis. Therefore, the IWG considered that outstanding credit by Scheduled Commercial Banks including RRBs would be an appropriate credit aggregate for the purpose of empirical analysis. 3.16 For credit aggregate comprising outstanding credit by Scheduled Commercial Banks including RRBs, the data on bank credit was available for a long period, as far back as the mid-1990s. However, similar time series was not available for some of the other variables used by the IWG in its analysis, such as Gross NPA (GNPA) growth, etc. Hence, the IWG decided to use time series data from March 2001 onwards for the present exercise. 3.17 In India, availability of the GDP data at quarterly frequency is relatively recent, with official data available only from 1996-97. Consistent series of quarterly GDP is available only for the base year 1999-2000. In order to maintain consistency and avoid break in series at the change of base year, data for the recent years, viz., 2009-10 to 2011-12 was re-computed for the 1999-2000 series using the latest available actual data and growth rates for the subsequent period. Data on GDP was sourced from Handbook of Statistics on Indian Economy13. 3.18 The GDP data also had substantial seasonal variation, which needed to be taken into account before computing the credit-to-GDP ratio. Therefore, the standard method of seasonal adjustment to the data, viz., X12-ARIMA (Auto-Regressive Integrated Moving Average) was used. 3.19 For determining thresholds for CCCB framework, the IWG had the option of adopting the framework suggested by the Basel Committee, as already discussed in Chapter 2. 3.20 However, looking at India specific circumstances, especially the stage of economic development, the degree of maturity of financial markets, the institutional framework and the process of structural transformation underway, it was felt that these thresholds should be assessed using India-specific data, and if required, be recalibrated. 3.21 For measuring credit-to-GDP gap, Basel Committee has recommended the use of one-sided Hodrick-Prescott (HP) filter with the lambda factor of 400000 to estimate the long term trend of credit-to-GDP ratio. While HP filter is a popular method of estimating trend component of economic time series, it has been found to have certain limitations, which are discussed in Vuuren (2012). There are primarily two issues where differences of opinion are found in the literature, one about the value of smoothening parameter lambda and other about using one-sided or two sided filter. The one sided filter uses only the data upto the particular point in time series, for which trend value is being estimated, while the two-sided filter uses the entire sample. The commonly used values of lambda for quarterly and annual data are 1600 and 100 respectively. As the lambda increases the HP filter trend moves closer to a linear trend in standard two-sided HP filter. The trend would not be, however, linear in the suggested one-sided implementation. 3.22 Looking from the policy perspective, use of data upto the relevant time point is most appropriate, as one cannot be expected to base decisions based on numbers that will be estimated using future values. However, when implementing the HP filter for post-facto analysis, two-sided filters are commonly used. The process of implementing one-sided filter is iterative in nature and is more intensive. On the other hand, while using one-sided filter, there are a few empirical issues that are faced. As the sample size is increased by one point for each iteration, the final trend series estimated using this procedure will be based on samples of varying size for each point. Further the sample for the initial points in the time series is very small. Therefore, to work out a reasonably useful trend using one-sided HP filter would require a long time series. Given the limitations of data availability, particularly the quarterly GDP (before 1996-97) and other related variables (before 2001-02), using one-sided filter was not feasible. The IWG recognized this as a limitation and decided to proceed with use of two-sided HP filter for the purpose of analysis. 3.23 The following chart (chart 1) plots movement of credit-to-GDP ratio against the long term credit-to-GDP trend. The difference between the two at any point in time would be the credit-to-GDP gap. Chart 1: Credit-to-GDP ratio and credit-to-GDP trend  3.24 The credit-to-GDP gap exhibited a cyclical pattern on expected lines. However, given the data constraint, the sample period was short and hence, not many complete cycles could be seen in the graph. 3.25 The analysis carried out using credit-to-GDP ratio and the credit-to-GDP gap could not provide substantial input for calibrating the CCCB. This may be due to the following reasons: 3.25.1 In a structurally transforming economy with rapid upward mobility, growth in credit demand will expand faster than GDP growth for several reasons:
3.25.2 Inferences from credit-to-GDP gap may be misleading as it will be difficult to identify what and how much is due to structural transformation and how much is due to excessive credit growth. Triggering the CCCB too early out of excessive caution may involve sacrifice of growth. On the other hand, complacency and failure to trigger buffer decision may lead to build up of pressure. 3.26 As credit-to-GDP gap, on its own, failed to provide guidance on the CCCB framework, the IWG used GNPA data along with the credit-to-GDP data for this purpose. NPAs, as already mentioned in the Chapter 2, are closely related to the economic cycles and are accentuated during periods of stress. The IWG felt that the systemic risk can be captured best by viewing the movement of GNPAs of the banking system. Accordingly, the threshold calculation is based on the relationship between the credit-to-GDP gap and the growth of GNPAs of the banking system. 3.27 As the CCCB should be turned on before the onset of systemic risk, it is necessary to determine the empirical lag at which the credit-to-GDP gap should be assessed with respect to the materiality of the systemic risk. 3.28 This analysis was carried out using quarterly data that covers a period from Q3 of 2001 until Q4 of 2012. As the data for nominal credit and GDP used is of quarterly frequency – the credit-to-GDP ratio has been de-seasonalised using the X12 method of the US Bureau of census. The said ratio is then filtered using the two-sided HP filter using the standard value of λ =400000. 3.29 Chart-2 presents the plot of credit-to-GDP gap and the annual growth of GNPA of the banking industry in India. The chart clearly demonstrates presence of pro-cyclicality in the two series in question, albeit with discernible lags. Chart-2: Credit-to-GDP gap and GNPA growth  3.30 To identify the lags between credit-to-GDP gap and annual growth in GNPA, a regression corrected for first order auto-correlated errors was run for various lags. It was observed that the regression with lag of nine quarters provides the best fit as could be observed from the table-2 and chart-3 below. Chart 3: Coefficient of determination at different lags  3.31 The resultant regression equation is as under.
The estimates in the regression equation imply that a single percentage point increase in credit-to-GDP gap results in an increase of 0.96 percentage point in GNPA growth. The value of the constant at 3.32 (percentage points) indicates that, on average, this portion of the annual average GNPA growth remains to be explained by other factors which may not be related to the variation in credit-to-GDP gap. According to the estimated equation, the credit-to-GDP gap leads GNPA growth statistically significantly by sufficient period with a peak statistical significant period of nine quarters. Hence, given the lag identified by the analysis, the CCCB should be triggered much before the expected onset of GNPA deterioration. 3.32 Chart-12 shows the CUSUM14 (Cumulative Sum) plot test for the equation reported above implying that the relationship was by and large stable.  3.33 The Basel Committee has suggested that any increases in the CCCB need to be pre-announced by up to 12 months to give banks time to meet the additional capital requirements before they take effect. Hence, to give banks a reasonable amount of time to adjust their capital plans, the IWG recommends that the CCCB decision be pre-announced with a lead time of up to 12 months (4 quarters) as prescribed by the Basel Committee. Threshold estimation for CCCB decision – Sarel methodology 3.34 Identification of the CCCB trigger can be based on charting evidence on the stability of the relationship between the credit-to-GDP gap and GNPA growth. However, for a more formal analysis to estimate the CCCB trigger threshold, the IWG used the popular methodology suggested by Sarel (1996)15. This method uses a single regression with iteration over different threshold cut-offs for the range of values observed for the explanatory variable in the sample. The threshold is then determined both on the basis of the explanatory power of the equation and the evolving significance of the coefficient in question. The results obtained from this methodology are presented in Table-3 below. 3.35 Estimates in Table-3 above suggest that the CCCB trigger should be activated as soon as the credit-to-GDP gap reaches 3 percentage points. This is because for coefficient of credit-to-GDP gap for values above the threshold, coefficient of determination becomes maximum at that level and remains high for further values of the threshold. Incidentally, this estimated level of the trigger is close to that suggested by the Basel Committee at 2 percentage points. Hence, the IWG decided to recommend setting of the lower threshold (L) at 3 percentage points. 3.36 As regards the upper threshold (H) when the CCCB reaches its maximum, the IWG noted that in the guidance provided by the Basel Committee, there is a difference of 8 percentage points between upper threshold (10 percentage points of credit-to-GDP gap) and lower threshold (2 percentage points of credit-to-GDP gap). However, the IWG felt that in India, growth related concerns would at times require rapid credit expansion. Further, India being an emerging market economy, our macro-economic conditions and growth related requirements cannot be compared with other countries, especially developed countries, and hence, the upper threshold of 10 percentage points of credit-to-GDP gap may be on the lower side and may not be suitable in Indian context. 3.37 Empirical evidence in the past decade shows that the credit-to-GDP gap has exceeded 20 percentage points only in one quarter, and even came close to that level only during two earlier quarters. Further it was observed that credit-to-GDP gap has immediately fallen sharply after each peak, due to a combination of several factors, including the policy response. The average credit-to-GDP gap during a run of positive values from September 2005 to September 2009 worked out to 11.56 percentage points. Out of these 17 quarters, the value has remained close to the average in the band of 8-12. The credit GDP gap exceeded the 15 percent mark only on four occasions. Moreover, the Basel Committee has observed that upper threshold should be low enough, so that the buffer would be at its maximum prior to major banking crises. Considering these factors, the IWG felt that a threshold value of 15 percentage points may be identified to deploy the maximum value of CCCB, in view of the rarity with which this threshold has been breached in the recent history. 3.38 Hence, as far as credit-to-GDP gap guidance of Basel Committee is concerned, the CCCB may phase-in once the credit-to-GDP gap reaches 3 percentage points, provided its relationship with GNPA growth remains significant. In such a case, the CCCB shall linearly increase in value till it reaches 2.5 per cent of the risk weighted assets corresponding to 15 percentage points of credit-to-GDP gap, after which, the CCCB will remain constant. Of course, the final decision on CCCB will be made based on performance of other indicators also, as discussed in Chapter 4. Supplementary Indicators 4.1 The Basel Committee guidance on the issue of CCCB, as also a number of other research papers on the subject clearly recognized that the credit-to-GDP gap may not be the only guide to make decisions on activation and release of the CCCB. Moreover, statistical measures, such as the one based on credit-to-GDP ratio, may not always be capable of capturing the cycles immediately. There are several other indicators suggested in the literature to indicate the build-up of system-wide risk. In view of this, the IWG felt that it may be desirable that additional information may also be used for CCCB decision,. 4.2 As discussed in Chapter 2 of this Report, the BCBS guidance note suggests a few variables which may be useful indicators in the build-up and release phases of CCCB. The IWG considered the indicators suggested by the Basel Committee as also their variants in the Indian context as possible supplementary indicators. In addition, other information collected by the RBI as part of monetary policy, banking supervision and for supporting other internal functions was also considered as possible supplementary indicators. While reviewing the utility of the indicators, the IWG followed the approach of taking into account the empirical observations from the Indian economy and the literature from official as well as academic sources. 4.3 The list of indicators initially considered as additional indicators is as follows:
Asset Prices 4.4 Among the other asset prices, property prices are considered to be relatively more useful predictors of banking crises. In India, the property price index is a relatively new concept. The quarterly House Price Index (HPI) for various centres is based on the official data on registration of property sale/purchase deed collected from the Department of Registration and Stamps (DRS) of various State governments. HPI for nine centres viz., Mumbai, Delhi, Bengaluru, Ahmedabad, Lucknow, Kolkata, Jaipur, Kanpur and Chennai are compiled presently by the RBI. Observations are stratified in three size-categories (small, medium and large houses) as also different locations. The weighted average price based on median is used to develop the index. Weights are estimated using the proportion of transactions in the base period. 4.5 Another property price indicator is the RESIDEX index of National Housing Bank (NHB), launched on July 10, 2007. Presently the residential housing sector is the only constituent of the index, though it is envisaged that the index may be expanded at a later date to include commercial property and land also. As the number of data points available in the index is not much, and also as the index is in formative stage, it was not considered as one of the supplementary indicators. However, going forward, this index may form a part of supplementary indicators for CCCB decision. 4.6 The IWG, therefore, recommends that going forward, indices like quarterly House Price Index (HPI) published by RBI and RESIDEX published by National Housing Bank may be used, provided the time series are long enough to facilitate such analysis. 4.7 Equity is another important asset class, and the equity market is one of the most liquid markets in India. However, in the context of equity prices, research is divided on the suitability of using equity market data for meaningful inferences. Borio and Lehmann (2009) refer to what is called “paradox of financial instability”, implying that the system gives all the signals of stability, when it is at the most vulnerable stage. Risk premia, volatility and leverage etc., are low and the prices are strong. With such behaviour, these indicators provide “a false sense of security” to the policymakers (Borio, 2011). However, equity prices are considered to be a leading indicator, as stock prices represent to some extent, the expectation of investors on the performance of a company. This indicator was, therefore, assessed as part of an array of supplementary indicators to reinforce the CCCB decision. 4.8 Table-4 enumerates the correlation of NSE 500 stock returns with the two main variables considered for buffer decisions, viz., GNPA growth and credit-to-GDP gap. The analysis shows that expectedly, the correlation between stock returns and GNPA growth is negative statistically significant. But the correlation of stock returns with credit-to-GDP gap is insignificant and does not show any indication of significant correlation with reasonable lead/lag. Therefore, its utility as a supplementary indicator appears rather limited. 4.9 Gold is one of the important asset classes that are considered to be a “safe haven”, particularly during periods of crises or stress. This particular behavior of the investors towards gold makes it an important indicator to assess build-up of systemic risk. According to Mishra and Mohan (2012), financial instability implications of gold prices to the Indian financial system depend on: (a) whether gold is in a state of bubble or not and (b) the nature and significance of gold in the overall financial architecture. Gold, unlike a financial asset, is not associated with cash inflows. This makes it somewhat difficult to judge on a historical basis whether it is in a state of bubble or not and thus to predict the nature of correction in gold prices in the immediate future. Theoretically, the severity of the impact a correction in any asset price (including gold) would have on the financial system would depend upon the nature of the ownership of the asset. Specifically, if those assets are held by banks and financial institutions, (collectively financial intermediaries), either directly or indirectly through collateral, the severity of impact of a bursting of a bubble would be severe. However, gold was not considered as a significant indicator in this analysis. Credit – Deposit Ratio 4.10 The credit-deposit ratio has been an integral part of micro-prudential monitoring in India. While the absolute C-D ratio is a function of several factors, including the statutory requirements, such as CRR and SLR, incremental C-D ratio provides an insight into the possible over-heating of the credit market and use of alternate sources of funding by the banks. These alternative sources of funding may be of high cost as well as less stable, thereby increasing the roll-over risk in the periods of crisis. Further credit extended out of such sources may not provide adequate spread, on margin, to cover the incremental risk of such loans. 4.11 However, use of incremental C-D ratio with quarterly increments provides a volatile series, and does not provide a complete view about emerging riskiness of the funding side on the balance sheets of the banks. Therefore, a suitable combination of absolute and incremental C-D ratio may provide a better view of leverage of banks. Choudhary and Gopinath (2012) have analysed this aspect and found that the composite C-D ratio provides an alternate CCCB guide. 4.12 Examining the conventional indicators of C-D ratio reveals that the quarterly incremental C-D ratio is quite volatile and has high degree of noise which renders it ineffective in tracking the incipient risks in the financial system. On the other hand, the cumulative C-D ratio does not adequately capture the recent changes in credit growth and the manner in which credit growth has been funded. 4.13 Incremental C-D ratio for moving period (one year to three years) was analysed. It can be observed from Table-5 that the incremental C-D Ratio has negative contemporaneous correlation with GNPA growth. However, increase in incremental C-D ratio for moving period of three years leads to GNPA growth by about 8 quarters. 4.14 Increase in the incremental C-D ratio also moves along with increase in credit-to-GDP gap and also causes the gap to increase in about 4-5 quarters as indicated by statistically significant correlation coefficients. Therefore, this indicator provides an early warning signal before the signs of weakness show up in the primary indicators, viz., credit-to-GDP gap and GNPA. 4.15 The IWG decided to recommend use of incremental C-D ratio for moving period of three years, as also, its correlation with credit-to-GDP gap and GNPA growth as an additional indicator to facilitate CCCB decision. Industrial Outlook Survey 4.16 Industrial Outlook (IO) Survey is an opinion based forward looking survey covering select public and private limited companies in the manufacturing sector and is being conducted on a quarterly basis by the RBI. The survey collects qualitative response (increase/decrease/no change) on 20 major parameters for two quarters. 4.17 The objective of the Survey is to get the performance and business assessment/prospect of the Indian manufacturing companies with regard to economic and industrial environment. The IO Survey captures the comprehensive assessment of the business environment in terms of growth opportunities as well as risks and uncertainties. 4.18 Currently, the sample covers about 2000 public and private limited companies in the manufacturing sector. The small companies (with paid up capital below ` 50 lakh) are not included in the sample. 4.19 The survey schedule is short and contains five blocks with simple qualitative questions. It seeks the assessment on the current business situation from manufacturing companies and their outlook for the next quarter through a set of structured questions covering different performance parameters. An additional block (Block 6) on investment intentions is annually canvassed in the April-June quarter for the purpose of getting an assessment of the investment intention of the manufacturing companies and their outlook for the next year. The answers to the majority of the questions are measured on a 3-point scale (e.g. increase, decrease and no change). Table-6 below shows the plot of assessment and expectations index computed using the Industrial Outlook Survey. 4.20 Empirical evaluation of the assessment index computed from the IO Survey indicates that the index shows a significant negative correlation with the GNPA growth, implying higher GNPA growth if the index is low and vice versa. Further, there is no contemporaneous correlation between IO Survey Assessment index and credit-to-GDP gap though there is some correlation between them with a lag of over a year. So, higher IO Survey assessment index is an indicator of both the factors that lead to high credit growth, viz., periods of improvement in GNPA situation and probable relaxation of credit standards. However, the IWG decided to recommend that IO Survey assessment index along with GNPA growth may be used as a supplementary indicator to facilitate CCCB decision. Corporate Sector ability to meet debt obligations 4.21 One way of looking at the corporate sector’s ability to repay its debt and interest is to look at the NPA data from the banks. But the other, and more direct, way of measuring the same is to look at the financial statements of the corporate sector. As part of improving corporate sector disclosures and transparency brought about in the wake of financial liberalization and increased globalization, the corporate sector, at least the segment listed on stock exchanges, publish their financial results (abridged and un-audited) at quarterly frequency. These provide a valuable source of information, when tracked on a consistent basis. 4.22 For the purpose of various analytical requirements, and to get better understanding of the economic performance, the RBI has been tracking this data source for past several years. Consistent time series of the ratios and rates is available since the financial year 2000-01. 4.23 The main indicators available at quarterly frequency are the sales, expenditure, raw material cost, staff cost, change in stock, operating income, interest payments, tax provisions, depreciation and profit before and after tax. A reasonable sample of about 2000 companies is regularly analysed based on these variables and their growth rates and ratios. Of the various indicators, the profitability margin and the interest burden are of particular importance to assess the stress (or otherwise) faced by the corporate sector. As the sample is sufficiently large and covers most of the industry segments, these trends can be taken as representative indicators. 4.24 It is recognized that while interest burden will indicate the rising / falling interest rate regime as per the monetary policy at a particular point in time, it also points at the pressure on margins from other sources, which squeeze / ease the financial position of these corporate sector. 4.25 On examining the relationship of the interest coverage ratio to GNPA growth, it is found that there is no contemporaneous correlation between these indicators. 4.26 However, when the correlation between interest coverage ratio and credit-to-GDP gap is examined, it is seen that in the periods of high credit-to-GDP gap, the companies are also having comfortable interest coverage, thereby indicating healthy financial position. Looking at the significant correlation of interest coverage ratio with credit-to-GDP gap, the IWG recommends its inclusion as one of the supplementary indicators to supplement the counter cyclical buffer decision. Credit Condition Survey 4.27 Credit Condition Survey (CCS) is a survey of qualitative information on major factors affecting credit, which are especially important in the context of expansion as well as contraction in specific sectors of the economy. The survey is aimed at enhancing the analysis of credit conditions by the RBI. In a scenario, when it is relatively easy to monitor the credit supply by the banks, but no direct quantitative data is available on credit demand, this type of survey becomes useful. This is a forward-looking survey and seeks information on various aspects of credit, including developments in credit sector and causes thereof. Banks may also find the aggregate results useful for their own analysis. The RBI has been conducting this survey on a quarterly basis since January-March 2010, in the months of March, June, September and December. One survey quarter is referred as one survey round. As this survey is relatively recent with only two years’ quarterly data, it may not be possible to use the results of CCS immediately. However, this may be a very useful indicator, going forward. 4.28 The IWG recommends that going forward, the CCS data may be used for CCCB decision, provided the time series are long enough to facilitate such analysis. Use of Sectoral Approach 4.29 Due to lack of availability of a long time series of a credible real estate index, the IWG could not use this critical indicator in the present exercise for CCCB implementation, but has recommended it as a forward looking indicator. The IWG observed that looking at the level of development of market infrastructure in our country, as also due to lack of availability of long time series of data, there may be some sectors (like the real estate sector) that may be critical due to their bearing on financial stability, but may not be a part of CCCB decision. Credit growth to certain sensitive sectors may lead to formation of asset bubbles and also significantly outpace the overall credit growth. Excessive credit growth in specific sectors may have significant financial stability risks. 4.30 The RBI has been applying countercyclical capital and provisioning requirements based on the analysis of sectoral credit growths. In the build-up phase, the tightening of prudential requirements made credit to targeted sectors costlier thereby moderating the flow of credit to these sectors. There is evidence that moderation in credit flow to these sectors was due in part to banks becoming cautious in lending to these sectors on the signalling effect of RBI’s perception of build up of sectoral risks. This way the exposure of banks to these sectors was reduced. Looking at such sector specific peculiarities in our country and their subsequent impact on implementation of macro-prudential policies, the IWG recommend that the CCCB framework in India may have to work in conjunction with sectoral approaches. IWG view on choice of indicator(s) 4.31 The Basel Committee has prescribed credit-to-GDP ratio and credit-to-GDP gap as a guide and a useful common reference point in deciding CCCB framework. However, they have admitted that this guide does not always work well in all jurisdictions at all times and have cautioned against using this guide mechanically. Judgment coupled with proper communications is thus an integral part of the CCCB regime. The CCCB guide should also be internationally consistent. 4.32 The IWG noted the guidance of the Basel Committee, and in its analysis, has endeavoured to enunciate principles that would work in conjunction with judgement so as to establish a sound framework of CCCB in India, as also, to facilitate further decision-making in the setting of CCCB. 4.33 To that end, the IWG took a stock of available indicators that are relevant to our banking system. The IWG was of the view that the demands of the Indian economy and the dynamics in our domestic financial markets are different from that of other countries. Hence, instead of depending solely on one indicator, the decision on CCCB should be taken considering the dynamics of various supplementary indicators. Further, the analysis should also include the correlations that these supplementary indicators have with the GNPA growth. In the analysis, it is observed that supplementary indicators such as incremental C-D ratio and IO Survey Assessment index have a significant relationship with the GNPA growth. Similarly, interest coverage ratio has a significant relationship with the credit-to-GDP gap. Further, the lag at which these relationships get significant is more than 4 quarters (i.e. 12 months), which the IWG recommends as the period for pre-announcement of imposition of the CCCB. 4.34 The analysis of all the indicators on an ongoing basis will provide sufficient information inputs to the RBI to decide whether it is necessary to activate the CCCB. As the empirical evidence on the basis of any single indicator may not be conclusive, the IWG recommends that decision making in respect of CCCB may be similar to the multiple indicator approach followed in policy making. In any case, the Basel Committee has provided ample freedom to the national authorities to “...apply judgment in the setting of the buffer in their jurisdiction after using the best information available to gauge the build-up of system-wide risk.” Hence, the IWG felt that the RBI may apply discretion in terms of use of indicators while activating or adjusting the buffer. Countercyclical Capital Buffer Release Phase 5.1 Under certain circumstances, it may be necessary to release the CCCB accumulated by the banks. This release may be warranted where there are losses in the banking system that pose a risk to financial stability or when there are systemic issues. In the case of the former, immediate release of CCCB would be desirable so that it is used for absorbing the losses before the banks begin depleting their normal capital conservation buffers. Further, in case when problems elsewhere in the financial system cause disruption to the flow of credit, thereby impacting the growth adversely, the release of CCCB should be immediate to stem the crisis from impacting the banking system and resultant losses. In other words, the variables guiding the release phase should react sufficiently promptly. 5.2 The Basel Committee observes that macro variables may not be ideal indicator variables for signalling the release phase. Its document states that “…While credit and GDP often contract around crises, this is not always the case as was experienced in various countries (Germany, Switzerland, the United Kingdom and the United States) during recent global financial crisis where real GDP continued to grow for over a year after the crisis materialized. Indicators of credit conditions may, on the other hand, provide useful information to identify bad times. But they are survey based and therefore potentially vulnerable to manipulation”. 5.3 Indicators of banking sector conditions such as aggregate profits, non-performing loans, etc., provide mixed signals for the release phase. Though asset prices are useful indicators as their frequency of availability is higher than quarterly macro data or information from bank balance sheets (which may only be available annually in some cases), these may actually result in releasing the CCCB too early. However, these are useful in explaining the need to release the CCCB after the financial system comes under stress. 5.4 Spreads such as CDS spreads, funding cost, etc., can emerge as alternative market based indicators especially as they were able to capture the onset of the recent crisis. However, in India we do not have a CDS series available and the corporate credit spreads data series may also not be representative due to a not so active corporate bond market. In any case, corporate credit spreads may not be considered as a useful indicator as their correlation with systemic banking crises is yet to be established. The historical evidence for the TED spreads is also ambiguous. Moreover, as empirical evidence is not there for other crises, the case for using these variables in a prescriptive fashion is not robust enough. 5.5 The IWG noted that as the CCCB approach is evolving and countries are trying different indicators that suit their domestic conditions, there is an element of inexperience in terms of implementation of CCCB decision, especially when it comes to release phase. The same has also been articulated in the guidance document of the Basel committee. A myriad of indicators have been discussed in the preceding chapters that can be used during the activating phase of the CCCB. For the release phase, the same set of indicators may be used. However, owing to inherent uncertainty and the lack of experience associated with operating of CCCB, the IWG felt that instead of hard rules-based approach, flexibility in terms of use of judgement and discretion may be provided to the RBI for operating the release phase of CCCB. 5.6 Further, as far as release of CCCB is concerned, following three options were available to the IWG.
5.7 The IWG observed that gradual release of CCCB or even its release in discrete time/amount may not serve the basic purpose of having a CCCB in place. The IWG felt that in case of crisis in banking sector or any other sector indirectly impacting the banking sector, it is prudent to stem the crisis early. Hence, releasing the complete CCCB at a single point in time may provide the required buttress to the banking system and hence, may stem the resultant losses therein. The IWG recommends that the release of CCCB should be prompt and in a timely fashion and that the RBI may use judgement and discretion instead of hard rules-based approach, so as to have flexibility during the release phase. Other issues Treatment of surplus when CCCB returns to zero 6.1 The Basel Committee has observed that when the CCCB returns to zero, the capital that is released may be used by the banks to absorb losses or to protect themselves against the impact of problems elsewhere in the financial system. In such a case, the capital surplus created should be unfettered and there should be no restrictions on distribution of this capital. However, they have left the final decision in the hands of national authorities. The IWG noted the importance of capital in our system and felt that unfettered access to capital by banks may not be prudent. Hence, the IWG recommends that the RBI would provide necessary guidance to the banks on the treatment of surplus when the CCCB returns to zero. Jurisdictional reciprocity 6.2 The Basel Committee has recommended jurisdictional reciprocity so as to ensure level playing field between domestic banks and foreign incorporated banks. The host jurisdiction may prescribe CCCB requirement for the exposures of all the banks in its jurisdiction. However, the home jurisdiction may impose higher CCCB requirement for the banks they supervise, in case they feel that the same is inadequate. Moreover, should the home supervisor stipulate lower CCCB requirement in the host jurisdiction (lower than that prescribed by the host jurisdiction), it may distort the level playing field between the domestic and foreign banks in host jurisdictions and also, it may discourage implementation of CCCB. 6.3 The IWG felt that jurisdictional reciprocity is important as it would provide level playing field for all the banks in India and hence, both the domestic banks and the foreign incorporated banks will be required to maintain CCCB based on their exposure in India. IWG recommends that all the banks operating in India (either foreign incorporated or domestic banks) should maintain capital under CCCB framework based on exposures in India. The RBI may convey the CCCB requirement to the home supervisor of the foreign incorporated banks so that they may ensure that their banks maintain adequate capital under CCCB as prescribed by the RBI. IWG also felt that the banks incorporated in India having international presence may maintain adequate capital under CCCB as prescribed and communicated by the respective host supervisors to the RBI. The RBI may also ask Indian banks to keep excess capital under CCCB framework in any of the host countries they are operating if it feels the CCCB requirement in the host country is not adequate. In case the CCCB requirement in other jurisdiction is nil / insufficient, the RBI may require that the banks maintain higher buffers. Communication of CCCB decision 6.4 The Basel Committee has noted that the buffer in each jurisdiction is likely to be used infrequently, and hence, instead of making quarterly statements on CCCB decision on an on-going basis, the authorities may comment on at least an annual basis. Hence, the IWG recommends that in India, CCCB decisions may form a part of the annual monetary policy statement of the RBI. However, more frequent communications can be issued by the RBI, if there are sudden and significant changes in economic condition that may warrant CCCB decision. 6.5 The IWG also recommends that at the time of communicating CCCB decision, the RBI may disclose, at its discretion, the mechanics of the CCCB approach, the information that was used to arrive at the decision, the time line of the CCCB activation, etc. Interaction with Pillar 1 and Pillar 2 6.6 The IWG felt that the CCCB incorporates elements of both Pillar 1 and Pillar 2. The IWG also noted that it would not be desirable for a bank maintaining CCCB to hold capital under Pillar 2 requirement for financial system-wide issues. Further, the IWG recommends that the capital meeting the CCCB should not be permitted to be simultaneously used to meet non-system-wide elements (e.g. concentration risk) of any Pillar 2 requirement. Location of the CCCB 6.7 The IWG noted that as in the case with the minimum capital requirement, host authorities would have the right to demand that the CCCB be held at the individual legal entity level or consolidated level within their jurisdiction. The IWG recommends that for all banks operating in India, CCCB shall be maintained at solo basis as well as at consolidated basis in India. Periodic Review 6.8 The IWG recognizes that CCCB is a new concept and is untested. Further, it is not likely that the CCCB would be imposed frequently. The indicators and thresholds used by the IWG may either show more robust results in due course of time or may even breakdown. Also, there is always a possibility of emergence of new indicators. Therefore, continuous research and empirical testing may be required and the indicators suggested in recommendation 9 such as House Price Index, RESIDEX, Credit Condition Survey, etc., should be further explored. Step-by-step guidance of an illustrative calculation methodology for countercyclical capital buffer imposition as mentioned in December 2010 BIS paper ‘Guidance for national authorities operating the countercyclical capital buffer’ Calculation for CCCB may be carried out by the national authorities as indicated in the following steps. Those are: Step 1: Calculation of the credit-to-GDP ratio Step 2: Calculation of the credit-to-GDP gap (the gap between the ratio and its trend) Step 3: Using credit-to-GDP gap to determine CCCB add-on Each of the above steps is described in detail below with an illustrative example at the end Step 1: calculation of the credit -to-GDP ratio The credit-to-GDP ratio at any period t for a country is calculated as: RATIOt=CREDITt / GDPt Х 100% GDPt is domestic GDP (after de-seasonalising with methods like X-12 ARIMA) and CREDITt is a broad measure (as inclusive as possible, more components of credit may be added in the study as more and more data become available to the national authorities) of credit to the private, non-financial sector in period t. Both GDP and CREDIT are in nominal terms and on a quarterly frequency. Step 2: calculation of the credit-to-GDP gap The credit-to-GDP ratio is compared to its long term trend. If the credit-to-GDP ratio is significantly above its long term trend (i.e. there is a large positive gap) then possibility is there that credit may have grown to excessive levels relative to GDP. National authorities need to ascertain that this growth in the ratio is indeed because of increase in credit (likely to be unsustainable) in comparison to its GDP. The gap (GAP) in period t for each country is calculated as the actual credit-to-GDP ratio at time t minus its long-term trend (TREND till period t): GAPt = RATIOt – TRENDt. TREND is a simple way of approximating something that can be seen as a sustainable average of ratio of credit-to-GDP based on the historical experience of the given economy. While a simple moving average or a linear time trend could be used to establish the trend, Hodrick-Prescott filter has been used by BIS in this regime as it has the advantage of giving higher weights to more recent observations. This is useful as such a feature is likely to be able to deal more effectively with structural breaks (very useful for emerging economies). The Hodrick-Prescott (HP) filter is a standard mathematical tool used in macroeconomics to establish the trend of a variable over time. For the purposes of this regime a one sided Hodrick-Prescott filter16 with a high smoothing parameter (lambda) set to 400,000, has been suggested by BIS to establish the trend (TRENDt). Step 3: Using the credit-to-GDP gap to determine CCCB add-on The size of the CCCB add-on at any period t (VBt) (in percent of risk-weighted assets) is zero when GAPt is below a certain threshold (L). It then increases with the GAPt until the CCCB reaches its maximum level (VBmax) when the GAP exceeds an upper threshold H. The lower and upper thresholds L and H are keys in determining the timing and the speed of the adjustment of the CCCB guide. BCBS analysis has found that an adjustment factor based on L=2 and H=1017 provides a reasonable and robust specification based on historical banking crises in a cross section of countries (both developed and emerging economies) across time. However, this depends to some extent on the choice of the smoothing parameter (lambda), the length of the relevant credit and GDP data, and the exact setting of L and H. Setting L=2 will imply that when: ((CREDITt / GDPt) Х 100%) – (TREND) <2%, the CCCB add-on is zero Setting H=10 will imply that when: ((CREDITt / GDPt) Х 100%) – (TRENDt) >10%, the CCCB add-on is at its maximum BIS has suggested the maximum CCCB add-on (VBmax) to be 2.5 per cent of risk weighted assets. As mentioned in step 3, if the credit-to-GDP ratio (CREDITt/GDPt) at any period t is 2 percentage points or less above its long term trend (TRENDt), the CCCB add-on (VBt) will be 0. On the other extreme, i.e., when the credit-to-GDP ratio (CREDITt/GDPt) at any period t exceeds its long term trend (TRENDt) by 10 percentage points or more, the CCCB add-on will be 2.5 per cent of risk weighted assets. When the credit-to-GDP ratio is between 2 and 10 percentage points of its trend, the CCCB add-on will vary linearly between 0 and 2.5 per cent. This will imply, for example, a CCCB of 1.25 per cent when the credit-to-GDP gap is 6 (i.e. half way between 2 and 10). Calibration of thresholds at which the guide indicates a CCCB requirement may be appropriate Some previous academic work has shown that the credit-to-GDP gap can be a powerful predictor for banking crises. Building on the general principle that the objective of the CCCB is to protect banks from periods of excess credit growth, the BCBS set out criteria to determine threshold GAP level L, when the rule should start building up capital buffers, and a GAP level H, at which the maximum CCCB should be reached. Given the current state of knowledge, the rule simply provides a starting guide to the relevant authorities responsible for deciding the CCCB add-on. These authorities retain the right to implement a different CCCB add-on than indicated by this simple guide, subject to providing a public and transparent explanation of this decision. Criteria for the minimum threshold (L) when the guide would start to indicate a need to build up capital 1. L should be low enough, so that banks are able to build up capital in a gradual fashion before a potential crisis. As banks are given one year to raise additional capital, this means that the indicator should breach the minimum at least 2-3 years prior to a crisis. 2. L should be high enough, so that no additional capital is required during normal times. Criteria for the maximum (H) at which point no additional capital would be required, even if the gap would continue to increase 3. H should be low enough, so that the CCCB would be at its maximum prior to major banking crises (such as the current episode in the US or the Japanese crises in the 90s). Calculating bank specific buffers - calculation methodology 1. This annex provides guidance to the banks which are having private sector exposures to institutions based in countries other than India. This will help in achieving jurisdictional reciprocity from India’s side. 2. Let us take an example and assume that the published CCCB add-ons in the India, USA, Netherlands and Japan are 2%, 1%, 1.5% and 1% of risk weighted assets, respectively. This means that any loans to USA counterparties will attract a CCCB requirement of 1% in respect of these loans. Similarly loans to Dutch and Japanese counterparties will attract CCCB requirements of 1.5% and 1%, respectively. As a consequence, a bank with 80% of its credit exposures to Indian counterparties, 10% to USA counterparties, 5% of its credit exposures to Dutch counterparties and 5% of its credit exposures to Japanese counterparties would be subject to an overall CCCB add-on equal to 1.825% of risk weighted assets: CCCB = (0.80*.02+0.10*.01+.05*.015+.05*.01) = 1.825% 3. Banks need to keep in mind that in cases where RBI feels that the CCCB add on by host jurisdiction is not reflecting the true risk of the exposures to that jurisdiction, RBI may always prescribe a higher CCCB requirement for banks’ exposure in that jurisdiction.
Anh, VO Thi Quynh [2011], Countercyclical capital buffer proposal: an analysis for Norway Financial Stability Research Department Staff Memo 3/2011 Norges Bank Bank of International Settlements [2010], A global regulatory framework for more resilient banks and banking systems, Basel Committee on Banking Supervision Bank of International Settlements [2010], Guidance for national authorities operating the countercyclical capital buffer, Basel Committee on Banking Supervision. Chakrabarty, K.C. [2011], ‘Post-Crisis: The New Normal’ – Key note address at RBI-Banque de France Seminar held at Paris on November 08, 2011 Drehmann M., C. Borio, L. Gambacorta, G. Jimenez and C. Trucharte [2010], Countercyclical capital buffers : Exploring options, BIS Working Paper 317. Bank of International Settlements Drehmann, Mathias, Claudio Borio and Kostas Tsatsaronis [2011], Anchoring countercyclical capital buffers: the role of credit aggregates, BIS Working Papers No 355, Bank of International Settlements Edge, Rochelle M. and Meisenzahl, Ralf R.[2011], The Unreliability of Credit-to-GDP Gaps in Real-Time: Implications for Countercyclical Capital Buffers. FED Working Paper No. 2011-37. Federal Reserve Board, Washington, D.C. Gopinath, Shyamala [2010], Macroprudential Approach to Regulation – Scope and Issues’ - Paper presented at the ADBI-BNM Conference on ‘Macroeconomic and Financial Stability in Asian Emerging Markets’, Kuala Lumpur, on Aug. 4, 2010 Gopinath, Tulasi and A. K. Chaudhary [2012], Counter Cyclical Capital Buffer Guidance for India, RBI Working Paper 12 / 2012 Reserve Bank of India Keller, Joachim: [2011], BCBS proposal for a countercyclical capital buffer: an application to Belgium, Financial Stability Review, National Bank of Belgium Mishra, Rabi N. and G. Jagan Mohan [2012], Gold Prices and Financial Stability in India. RBI Working Paper No. 02/2012, Reserve Bank of India Repullo, Rafael and Jesus Saurina [2011], The countercyclical capital buffer of Basel III: A critical assessment, CEPR Discussion Paper No. 8304, Centre for Economic Policy Research Reserve Bank of India [2011], Handbook of Statistics on Indian Economy 2010-11 Reserve Bank of India [2011], Macroeconomic and Monetary Developments, December. Sarel, M [1996], Nonlinear Effects of Inflation on Growth, Vol 43,No. 1, IMF Staff Papers. International Monetary Fund. Sinha, Anand [2011], ‘Reflections on Regulatory Challenges and Dilemmas’ – Address at FICCI-IBA Conference on “Global Banking: Paradigm Shift” at Mumbai on August 24, 2011 Subbarao Duvvuri [2010], ‘Post-crisis Reforms to Banking Regulation and Supervision – Think Global, Act Local’ - Inaugural address at the FICCI-IBA Conference on ‘Global Banking: Paradigm Shift’ on September 7, 2010 Subbarao, Duvvuri [2010], Dilemmas in Central Bank Communication: Some Reflections Based on Recent Experience – Second Business Standard Annual Lecture at New Delhi on January 7, 2011 Subbarao, Duvvuri [2010]: Five Frontier Issues in Indian Banking – Inaugural Address at ‘BANCON 2010’ in Mumbai on December 3, 2010 1 Kashyap and Stein (2004), Gordy and Howells (2006), and Repullo and Suauz (2009) 2 Rafael Repullo and Jesús Saurina, The Countercyclical Capital Buffer of Basel III: A Critical Assessment 3 The framework for countercyclical provisioning based on “expected loss” model rather than the “incurred loss” model currently in vogue, is being developed separately by the IASB and FASB, at the behest of the Basel Committee and G20. This Report does not cover that aspect. 4 Kashyap and Stein (2004), Gordy and Howells (2006), and Repullo and Suauz (2009) 5 Rafael Repullo and Jesús Saurina, The Countercyclical Capital Buffer of Basel III: A Critical Assessment 6 Strengthening the resilience of the banking sector, December 2009 7 Countercyclical capital buffer proposal – consultative document (BCBS), July 2010 8 The Basel Committee has suggested some variables that may be useful indicators to support inferences from the credit-to-GDP guide in both the build-up and release phases of the CCCB decisions. These indicators may include indicators such as various asset prices, funding spreads and CDS spreads, credit condition surveys, real GDP growth and data on the ability of non-financial entities to meet their debt obligations on a timely basis. 9 Credit-to-GDP gap is the difference between the ratio of credit-to-GDP with that of the long term average ratio of credit-to-GDP. 10 “Guidance for national authorities operating the countercyclical capital buffer” BCBS, December 2010. 11 On February 13, 2013, the Federal Council of Switzerland imposed CCCB based on proposal of the Swiss National Bank (SNB). The proposed capital buffer is targeted at mortgage loans financing residential property located in Switzerland. The proposal sets a level of 1% of associated risk-weighted positions, and a deadline for compliance with the CCCB of September 30, 2013. 12 “The countercyclical buffer of Basel III a critical assessment”, Rafael Repullo and Jesus Saurina, March 2011. 13 See http://www.rbi.org.in/scripts/AnnualPublications.aspx?head=Handbook of Statistics on Indian Economy 14 The popular CUSUM testing was suggested by Brown, Durbin and Evans (1975) to test the stability of the coefficients of an estimated regression equation. It is based on the cumulative sum of the recursive residuals from the regression. The test finds parameter instability if the cumulative sum goes outside the area between two critical straight lines drawn to indicate 95% confidence level. In this case the cumulative sum stays within the critical straight lines implying desired confidence level of the regression coefficients 16 In India, two-sided filter has been used in the analysis. 17 In Indian context the corresponding values of L and H are 3 and 15, respectively. |
||||||||||||||||||||||||||||||||||||||||||||||||||||||||||||||||||||||||||||||||||||||||||||||||||||||||||||||||||||||
Draft Enabling Framework for Regulatory Sandbox
1.1 The Reserve Bank of India (RBI) set up an inter-regulatory Working Group (WG) in July 2016 to look into and report on the granular aspects of FinTech and its implications so as to review the regulatory framework and respond to the dynamics of the rapidly evolving FinTech scenario. The report of the WG was released on February 08, 2018 for public comments. One of the key recommendations of the WG was to introduce an appropriate framework for a regulatory sandbox (RS) within a well-defined space and duration where the financial sector regulator will provide the requisite regulatory guidance, so as to increase efficiency, manage risks and create new opportunities for consumers. 1.2 Accordingly, a structured proposal highlighting the clear principles and role of the proposed RS, bringing out its pros and cons, including the reasons for setting up the RS and the expectations of the RBI, are detailed hereunder. 2. The Regulatory Sandbox: Principles and Objectives 2.1 The Regulatory Sandbox A regulatory sandbox (RS) usually refers to live testing of new products or services in a controlled/test regulatory environment for which regulators may (or may not) permit certain regulatory relaxations for the limited purpose of the testing. The RS allows the regulator, the innovators, the financial service providers (as potential deployers of the technology) and the customers (as final users) to conduct field tests to collect evidence on the benefits and risks of new financial innovations, while carefully monitoring and containing their risks. It can provide a structured avenue for the regulator to engage with the ecosystem and to develop innovation-enabling or innovation-responsive regulations that facilitate delivery of relevant, low-cost financial products. The RS is potentially an important tool which enables more dynamic, evidence-based regulatory environments which learn from, and evolve with, emerging technologies. 2.2 Objectives The RS provides an environment to innovative technology-led entities for limited-scale testing of a new product or service that may or may not involve some relaxation in a regulatory requirement before a wider-scale launch. The RS is, at its core, a formal regulatory programme for market participants to test new products, services or business models with customers in a live environment, subject to certain safeguards and oversight. The proposed financial service to be launched under the RS should include new or emerging technology, or use of existing technology in an innovative way and should address a problem, or bring benefits to consumers. 3. Regulatory Sandbox: Benefits The setting up of an RS can bring several benefits, some of which are significant and are delineated below: 3.1 First and foremost, the RS fosters ‘learning by doing’ on all sides. Regulators obtain first-hand empirical evidence on the benefits and risks of emerging technologies and their implications, enabling them to take a considered view on the regulatory changes or new regulations that may be needed to support useful innovation, while containing the attendant risks. Incumbent financial service providers, including banks, also improve their understanding of how new financial technologies might work, which helps them to appropriately integrate such new technologies with their business plans. Innovators and FinTech companies can improve their understanding of regulations that govern their offerings and shape their products accordingly. Finally, feedback from customers, as end users, educates both the regulator and the innovator as to what costs and benefits might accrue to customers from these innovations. 3.2 Second, users of an RS can test the product’s viability without the need for a larger and more expensive roll-out. If the product appears to have the potential to be successful, the product might then be authorized and brought to the broader market more quickly. If any concerns arise, during the sandbox period, appropriate modifications can be made before the product is launched in the broader market. 3.3 Third, FinTechs provide solutions that can further financial inclusion in a significant way. The RS can go a long way in not only improving the pace of innovation and technology absorption but also in financial inclusion and in improving financial reach. Areas that can potentially get a thrust from the RS include microfinance, innovative small savings and micro-insurance products, remittances, mobile banking and other digital payments. 3.4 Fourth, by providing a structured and institutionalized environment for evidence-based regulatory decision-making, the dependence of the regulator on industry/stakeholder consultations only is correspondingly reduced. 3.5 Fifth, the RS could lead to better outcomes for consumers through an increased range of products and services, reduced costs and improved access to financial services. 4. Regulatory Sandbox: Risks and Limitations 4.1 Innovators may lose some flexibility and time in going through the RS process (but running the sandbox program in a time-bound manner at each of its stages can mitigate this risk). 4.2 Case-by-case bespoke authorizations and regulatory relaxations can involve time and discretional judgements (this risk may be addressed by handling applications in a transparent manner and following well-defined principles in decision-making). 4.3 The RBI or its RS cannot provide any legal waivers. 4.4 Post-sandbox testing, a successful experimenter may still require regulatory approvals before the product/services/technology can be permitted for wider application. 4.5 Regulators can potentially face some legal issues, such as those relating to consumer losses in case of failed experimentation or from competitors who are outside the RS, especially those whose applications have been/may be rejected. These, however, may not have much legal ground if the RS framework and processes are transparent and have clear entry and exit criteria. Upfront clarity that liability for customer or business risks shall devolve on the entity entering the RS will be important in this context. 5. Regulatory Sandbox: Eligibility Criteria for Participating in the Sandbox The target applicants for entry to the RS are FinTech firms which meet the eligibility conditions prescribed for start-ups by the government. The focus of the RS will be to encourage innovations where
6. Design Aspects of the Regulatory Sandbox The RBI shall consider the following key design features for the RS: 6.1 Sandbox Cohorts and Product/Services/Technology The RS may run a few cohorts (end-to-end sandbox process), with a limited number of entities in each cohort testing their products during a stipulated period. The RS shall be based on thematic cohorts focussing on financial inclusion, payments and lending, digital KYC, etc. The cohorts may run for varying time periods but should ordinarily be completed within six months. An indicative list of innovative products/services/technology which could be considered for testing under RS are as follows. 6.1.1 Innovative Products/Services
6.1.2 Innovative Technology
6.2 Regulatory Requirements/Relaxations for Sandbox Applicant The RBI may consider relaxing, if warranted, some of the regulatory requirements for sandbox applicants for the duration of the RS on a case-to-case basis. However, regulatory requirements that shall mandatorily have to be maintained by the applicants are as follows:
6.3 Exclusion from Sandbox Testing The entities may not be suitable for RS if the proposed financial service is similar to those that are already being offered in India unless the applicants can show that either a different technology is being gainfully applied or the same technology is being applied in a more efficient and effective manner. An indicative negative list of products/services/technology which may not be accepted for testing is as follows:
6.4 Number of FinTech Entities to be Part of a Cohort The focus of the RS should be narrow in terms of areas of innovation, and limited in terms of intake. The RS shall begin the testing process with 10-12 selected entities through a comprehensive selection process as detailed in the framework under ‘Fit and Proper criteria for selection of participants in RS’. 6.5 Fit and Proper Criteria for Selection of Participants in RS 6.5.1 The entities should satisfy the following conditions:
6.5.2 The proposed FinTech solution should highlight an existing gap in the financial ecosystem and the proposal should demonstrate how it would address the problem, or bring benefits to consumers or the industry or perform the same work more efficiently. 6.5.3 The applicants should demonstrate that there is a relevant regulatory barrier that prevents deployment of the product/service at scale, or a genuinely innovative and significantly important product/service/solution is proposed for which relevant regulation is necessary but absent. 6.5.4 The test scenarios and expected outcomes of the sandbox experimentation should be clearly defined, and the sandbox entity should report to the RBI on the test progress, based on an agreed schedule. 6.5.5 The appropriate boundary conditions (refer to section 6.7) should be clearly defined for the RS to be meaningfully executed while sufficiently protecting consumers’ privacy. 6.5.6 An acceptable exit and transition strategy should be clearly defined in the event that the proposed FinTech-driven financial service has to be discontinued, or can proceed to be deployed on a broader scale after exiting the RS. 6.5.7 The applicants shall be required to share the results of Proof of Concept (PoC)/testing of use cases including any relevant prior experiences before getting admission into RS for testing, wherever applicable. 6.5.8 Significant risks arising from the proposed FinTech solution or financial service should be assessed and mitigated. 6.6 Extending or Exiting the Sandbox At the end of the sandbox period, the regulatory relaxations provided to the entities will expire and the sandbox entity must exit the RS. In the event that the sandbox entity requires an extension of the sandbox period, it should apply to the RBI at least one month before the expiration of the sandbox period and with valid reasons to support the application for extension. The decision of the RBI on the application will be final. The sandbox testing will be discontinued any time at the discretion of the RBI if the entity does not achieve its intended purpose, based on the latest test scenarios, expected outcomes and schedule mutually agreed by the sandbox entity with the RBI. Further, the RS may also be discontinued if the entity is unable to fully comply with the relevant regulatory requirements and other conditions specified at any stage during the sandbox process. The sandbox entity may also exit from the RS at its own discretion by informing the RBI one week in advance. The sandbox entity should ensure that any existing obligation to its customers of the financial service under experimentation is fully addressed before exiting the RS or discontinuing the RS. 6.7 Boundary Conditions When a sandbox operates in the production environment, it must have a well-defined space and duration for the proposed financial service to be launched, within which the consequences of failure can be contained. The appropriate boundary conditions should be clearly defined for the RS to be meaningfully executed while sufficiently protecting the interests of consumers. The boundary conditions for the RS may include the following:
6.8 Ensure Transparency Outreach with stakeholders and clear and adequate information to the participants in the RS is important. The RBI will communicate the entire RS process including its launch, theme of the cohort, and entry and exit criteria through its official website. 6.9 Consumer Protection The sandbox participant will be required to ensure that any existing obligations to the customers of the financial service under experimentation is fulfilled or addressed before exiting or discontinuing the RS. It may be noted that entering the RS does not limit the entity’s liability towards its customers. The entities entering the RS must be upfront and, in a transparent way, notify test customers of potential risks and the available compensation and obtain their explicit consent in this regard. 7. The Sandbox Process and its Stages in a Regulatory Sandbox 7.1 End-to-End Sandbox Process A detailed end-to-end sandbox process, including the testing of the products/innovations by FinTech entities, shall be overseen by the FinTech Unit (FTU) at the RBI. 7.2 The Sandbox Process: Stages and Timelines Each cohort of the RS shall have the following five stages and timeline: 7.2.1 Preliminary Screening (4 weeks) The FTU shall ensure that the applicant clearly understands the objective and principles of the sandbox and conforms to it. This phase shall last for 4 weeks from the launch of the sandbox, where the applications shall be received by the FTU and evaluated to shortlist applicants meeting the eligibility criteria. 7.2.2 Test Design (3 weeks) This phase may last for 3 weeks. The FTU shall finalize the test design through an iterative engagement with the applicants and identify outcome metrics for evaluating evidence of benefits and risks. 7.2.3 Application Assessment (3 weeks) This phase may last for 3 weeks. The FTU shall vet the test design and propose regulatory modifications, if any. 7.2.4 Testing (12 weeks) This phase may last for a maximum of 12 weeks. The FTU shall generate empirical evidence to assess the tests by close monitoring. 7.2.5 Evaluation (4 weeks) This phase may last for 4 weeks. The final outcome of the testing of products/services/technology as per the expected parameters including viability/acceptability under the RS shall be confirmed by the RBI. The FTU shall assess the outcome reports on the test and decide on whether the product/service is viable and acceptable under the RS. 8.1 Upon approval, the applicant becomes the entity responsible for operating in the RS. The RBI will provide the appropriate regulatory support by relaxing specific regulatory requirements (which the sandbox entity will otherwise be subject to), where necessary, for the duration of the RS. The RBI shall bear no liability arising from RS process and any liability arising from the experiment will be borne by the applicant as a sandbox entity. 8.2 Upon successful experimentation and on exiting the RS, the sandbox entity must fully comply with the relevant regulatory requirements. The applicant should clearly understand the objective and principles of the RS. It must be emphasized that the RS is not intended and cannot be used as a means to circumvent legal and regulatory requirements. 8.3 At the end of the sandbox period, the entity must exit the RS. The RBI shall reserve the right to publish any relevant information about the RS applicants on its website, including for the purpose of knowledge transfer and collaboration with other international regulatory agencies. ‘Fit and Proper’ Criteria for Director(s)/Promoter(s) of the Sandbox Entities 1. The Reserve Bank of India (RBI) shall satisfy itself that the promoter(s)/director(s) of the sandbox entity to be accepted to the regulatory sandbox (RS) meets the ‘fit & proper’ criteria based on the following documents submitted for each of the promoter(s)/director(s):
2. For the purpose of due diligence of the promoter(s)/director(s), in addition to the above, the entity shall obtain a ‘declaration and undertaking’ from the director(s)/promoter(s) in a standard format as furnished in Annex II. A copy of the same shall be forwarded to the RBI. Declaration and Undertaking by
1 An entity shall be considered as a Start-up: (i) Upto a period of seven years from the date of its incorporation/registration (ii) Turnover of the entity for any of the financial years since incorporation/registration has not exceeded Rs.25 crore (iii) Entity is working towards innovation, development or improvement of products or processes or services. | ||||||||||||||||||||||||||||||||||||||||||||||||||||||||||||||||||||||||||||||||||||||||||||||||||
Draft Depositor Education and Awareness Fund Scheme
DRAFT SCHEME (To be Notified in the Official Gazette) The Reserve Bank (Depositor Education and Awareness Fund) Scheme, 2014 The Reserve Bank of India, in exercise of the powers conferred by sub-sections (1) and (5) of Section 26A of the Banking Regulation Act, 1949 (10 of 1949) and of all the powers enabling it in this behalf, hereby makes the following Scheme, namely:- Chapter I 1. Short Title and Commencement: (i) This Scheme may be called The Reserve Bank (Depositor Education and Awareness Fund) Scheme, 2014. (ii) This Scheme shall come into force with effect from such date as specified in the Notification in the Official Gazette. Chapter II 2. Definitions: In this Scheme, unless the context otherwise requires:- (i) (a) ‘Act’ means the Banking Regulation Act, 1949 (10 of 1949); (b) ‘bank’ means a banking company, a co-operative bank, multi-state co-operative bank, State Bank of India, a subsidiary bank, a corresponding new bank and a regional rural bank; (c) ‘Fund’ means the Depositor Education and Awareness Fund established under paragraph 3; (d) ‘Committee’ means the Committee constituted under paragraph 8 to administer the Fund; (e) ‘Effective date’ means the date on which the Scheme comes into force as notified by the Reserve Bank; (f) ‘DICGC’ means the Deposit Insurance and Credit Guarantee Corporation established under section 3 of the Deposit Insurance Corporation Act, 1961; (g) ‘Liquidator’ means liquidator of a bank eligible to participate in the Fund, and appointed under any law for the time being in force; (h) ‘Principal amount’ means the amount, including interest, transferred by a bank to the Fund in terms of Section 26A of the Act; (i) ‘Amount due’ means any credit balances or account remaining unclaimed or inoperative for ten years or more; (ii) Words and expressions used in this Scheme and not defined herein, but defined in the Act, shall have the meaning respectively assigned to them in the Act. 3. Establishment of the Fund and Credits therein: (i) Reserve Bank hereby establishes a Fund to be called the Depositor Education and Awareness Fund referred to in Section 26A of the Act. (ii) The amounts to be credited to the Fund by banks shall be deposited in the specified account maintained with the Reserve Bank or such other banks, as may be specified by the Reserve Bank from time to time. (iii) For the purpose of this paragraph, the amounts to be credited to the Fund shall be the credit balances in any deposit account maintained with banks which have not been operated upon for ten years or more, or any amount remaining unclaimed for ten years or more, including:-
(iv) The classification of any deposit account as ‘unclaimed’ or ‘inoperative’, as at sub-paragraph (iii), would be as per the directions/guidelines issued by the Reserve Bank from time to time. (v) Any amount in foreign currency payable under an instrument or a transaction, that has remained unclaimed for ten years or more, shall be converted into Indian Rupees at the exchange rate prevailing on the date of conversion and transferred to the Fund, and in the event of a claim, the Fund shall be liable to refund only in Indian Rupees: Provided that if the validity period for payment of the instrument or transaction was not specified or legally prescribed at the time of issuance of the instrument or the date of transaction, as the case may be, the Fund shall refund the amount of the foreign currency claim in its rupee equivalent as on the date of payment by the bank concerned to the customer. (vi) A bank shall transfer to the Fund entire amount as specified in sub-paragraph (iii), including the accrued interest that the bank would have been required to pay to the customer/ depositor as on the date of transfer to the Fund. (vii) A bank shall calculate the cumulative balances in all such accounts as specified in sub-paragraphs (iii) and (v), as on the day prior to the effective date and transfer the amount to the Fund on the last working day of subsequent month along with the interest accrued as specified in sub-paragraph (vi). (viii) From the effective date, banks are required to transfer to the Fund the amounts becoming due in each calendar month (i.e., balances remaining unclaimed for ten years or more) as specified in sub-paragraphs (iii) and (v) and the interest accrued thereon as specified in sub-paragraph (vi), on the last working day of the subsequent month. (ix) Banks should preserve records/documents containing details of all accounts and transactions, including deposit accounts in respect of which amounts are required to be credited to the Fund, so that if any claim for refund arises, they may refund to the customer/ depositor such amount with interest, if applicable, as specified at sub-paragraphs (i) and (ii) of paragraph 4. (x) Notwithstanding anything contained in the Banking Companies (Period of Preservation of Records) Rules, 1985, the bank shall preserve such records/documents in respect of accounts and transactions, including deposit accounts as specified in sub-paragraph (ix) for a period of at least five years from the date of refund from the Fund. 4. Refunds and Interest: (i) The claim for refund of any amount from the Fund shall be made by banks based on payments made to a customer/ depositor whose unclaimed amount/deposit had been transferred to Fund. Banks shall repay the customer/ depositor, along with interest if applicable, and lodge a claim for refund from the Fund for an equal amount paid to the customer/ depositor. (ii) The interest payable, if any, from the Fund on a claim shall accrue only from the date on which the balance in an account was credited into the Fund and till the date of payment to the customer/ depositor. No interest shall be payable in respect of amounts refunded from the Fund, in respect of which no interest was payable by the bank to its customer/ depositor. (iii) In case of any claim for refund of part amount by the depositor whose unclaimed amount/inoperative deposit had been transferred to the Fund, the account ceases to be inoperative. The bank shall claim the entire amount transferred to the Fund with respect to such depositor along with any interest payable, if any, from the Fund. Such accounts shall thereafter be operative in the books of the bank. (iv) Refunds made by a bank in each calendar month should be claimed for reimbursement from the Fund on the last working day of the subsequent month. (v) Banks should maintain details of all accounts on deposits and other related documents in respect of which reimbursements have been sought from the Fund. (vi) Reserve Bank shall be empowered to seek all relevant information in respect of an account or deposit or transaction for which a claim for refund has been submitted by a bank. (vii) In case of liquidation of a bank, the Fund shall pay to the liquidator an amount equal to the amount payable by DICGC under the DICGC Act, 1961 in respect of each depositor whose account balances have been transferred to the Fund on account of being inoperative or unclaimed. Provided that no such payment shall be made in case the depositor concerned is eligible to get any amount from DICGC in respect of any account maintained with the same bank, in the same capacity and in the same right. (viii) The payment specified in sub-paragraph (vii) will be in addition to the refund made to the liquidator under the Act, and is meant only for distribution to such depositors or their legal heirs or nominees, as the case may be. The aforesaid amount shall be paid by the Fund only if a claim from the depositor concerned is received by the liquidator, and he, in turn, makes a claim on the Fund for the same. 5. Banks to submit Returns: Banks shall furnish returns to Reserve Bank in the form and manner as prescribed by Reserve Bank from time to time. 6. Accounts: (i) The Fund shall maintain its accounts including Income and Expenditure Statement as prescribed by the Committee. (ii) The amounts credited to the account of the Fund, maintained with Reserve Bank or such other banks, as may be specified by Reserve Bank from time to time, shall form part of Reserve Bank Balance Sheet. (iii) The amounts credited to the account of the Fund maintained with the Reserve Bank and such other banks may be invested by Reserve Bank and such other banks in such manner as prescribed by the Committee. (iv) All income of the Fund shall be credited to the Fund. (v) All expenditure incurred for the promotion of depositors’ education, awareness, interests and other purposes that may be specified by Reserve Bank under Section 26A (4) of the Act, shall be charged to the Fund. (vi) The excess of expenditure over income/income over expenditure, as the case maybe, shall be transferred to the Fund and shall not be transferred to Reserve Bank or such other bank maintaining the accounts of the Fund. 7. Audit of Accounts: (i) The accounting year for the Fund shall be from April 1 to March 31 of the subsequent year. Chapter III Constitution, Management and Functions of the Committee 8. Constitution of the Committee: (i) There shall be a Committee to administer and manage the Fund in accordance with the Scheme. (ii) The Committee shall consist of not more than eleven members as decided by the Reserve Bank, excluding Chairperson and shall consist of the following members, namely:- (a) a Deputy Governor of Reserve Bank, nominated by Governor, who shall be the ex-officio Chairperson of the Committee: (b) not more than five officers of Reserve Bank, not below the rank of Chief General Manager, nominated by it in this behalf from Department of Banking Operations and Development, Urban Banks Department, Rural Planning and Credit Department or any other department which Reserve Bank may deem appropriate; (c) Chairman and Managing Director or Chief Executive Officer of a bank by rotation, as nominated by the Reserve Bank; (d) not more than two members nominated by Reserve Bank, who are considered experts in the field of banking or accounting or any other field, which the Reserve Bank considers appropriate; (e) not more than two persons nominated by Reserve Bank, representing the interests of customers and depositors of banks, drawn from amongst organisations or associations formed by such customers or depositors and (f) an officer, not below the rank of Chief General Manager, nominated by Reserve Bank to act as Member Secretary to the Committee. (iii) Other members, except the ex-officio Chairperson, shall hold office for a period of two years and thereafter until their successors shall have been nominated. (iv) A retiring member shall be eligible for re-nomination. (v) Reserve Bank shall provide Secretariat for the Committee and necessary infrastructure and manpower to assist the Committee in the administration of the Fund. (vi) The Committee may constitute one or more Sub-Committees, from amongst its members, whenever it deems necessary to do so, to facilitate efficient and speedy discharge of its functions. (vii) Any defect in the constitution or any vacancy in the Committee would not invalidate any proceedings of the Committee or the decisions taken by the Committee. 9. Functions and Objects of the Committee: (i) The Committee shall frame its own rules of business. (ii) The Fund shall be utilised for promotion of depositors’ interests and for such other purposes which may be necessary for promotion of depositors’ interest as may be specified by the Reserve Bank. The Committee shall function keeping in view the purposes mentioned in Section 26A(4) of the Act and in accordance with the purposes that may be specified by Reserve Bank in this regard from time to time. (iii) The Committee may from time to time lay down a list of activities, the criteria and procedure, etc. for incurring expenditure and achieving the objectives of the Fund. (iv) The Committee shall administer the Fund and shall exercise all powers on behalf of the Fund, including incurring of all expenditure that may be charged to the Fund, and keeping the corpus of the Fund invested. (v) In the normal course, the Committee shall not use the principal amount for payment of interest or for incurring expenses in relation to the activities of the Fund. In exceptional situations, where the principal amount has to be utilised for payment of interest or for incurring expenses in relation to the activities of the Fund, the Committee shall record in writing its reasons for the same. (vi) For facilitating the determination of the rate of interest payable, the Fund shall provide to the Reserve Bank such returns and information on its income and expenditure, as may be required by the Reserve Bank. 10. Expenses of the Committee: The expenses of the Committee and other expenses for administration of the Fund shall be charged to the Fund as decided by the Committee. 11. Power to call upon the banks: (i) The Committee may call upon any bank to pay the amount due to the Fund. (ii) The Committee may call for any information relating to unclaimed amounts lying with the banks and inoperative accounts, in general or a bank in particular, from time to time, and it shall be the duty of such bank to furnish the information sought by the Committee. 12. Promotion of Depositors’ Interests and Recognition of Associations: (i) For the promotion of depositors’ interests, the Committee may register/recognise from time to time various institutions, organizations or associations, engaged in activities relating to depositor awareness and education, including those proposing to conduct programmes for depositors of banks, organizing seminars and symposia for depositors and undertaking projects and research activities relating to these areas. (ii) Institutions, organizations or associations registered/recognized by the Committee may be considered for grant of funds as a grant-in-aid either as one time measure or in stages or by way of reimbursement, depending upon the nature of the activity proposed. (iii) The Committee shall determine and lay down the criteria for grant of financial assistance to institutions, organizations and associations, as stated in sub- paragraph (i). (iv) The Committee may examine the proposals and the proposed end use of grants and assistance before authorising release of funds. (v) The Committee may call for information in respect of or verify in any manner, the end use of funds granted to such institutions, organizations or associations. (vi) The Committee may take such action as it deems fit in the interests of the Fund, including legal actions, as and when considered appropriate. 13. Interpretation of the provisions of the Scheme: If any issue arises in the interpretation of the provisions of the Scheme, the matter shall be referred to the Reserve Bank, and the decision of the Reserve Bank thereon shall be final. 14. Amendment of the Scheme: The Reserve Bank shall be free to amend the provisions of this Scheme from time to time, if so found necessary. 15. Power to remove difficulties: If any difficulty arises in giving effect to the provisions of this Scheme, the Reserve Bank may take such actions or pass such orders, as may appear necessary for the purpose of removing such difficulty. ( ) |
Report of the Internal Working Group on Comprehensive Review of Market Timings
Background 1.1. The Reserve Bank has, from time to time, been receiving requests for extension of timings for certain markets such as currency futures and Over-the-Counter (OTC) foreign exchange market. Accordingly, it was announced as a part of the Statement on Developmental and Regulatory Policies dated August 01, 2018, to set up an internal group to comprehensively review the timings of various markets and the associated payment and settlement infrastructure. Accordingly, an Internal Working Group (IWG) was set up comprising officials of the relevant Departments of the Reserve Bank. Terms of Reference 1.2. The terms of reference for the Internal Working Group are as follows:
Approach/Methodology of the Group 1.3. The Group followed the following approach.
Organisation of the Report 1.4. Following this introductory section, Section 2 gives an overview of the markets regulated by the Reserve Bank. Section 3 provides an overview of timings and the issues that merit review of timings followed by an analysis of various proposals examined by the Group and recommendations therein. 1.5. The report has four annexes. The results of empirical studies undertaken by the Group on linkages of rupee NDF and onshore exchange rate market are given in Annex-I. A summary of the literature studied by the Group is furnished in Annex-II. A few case studies related to extension of timing on exchanges in a few jurisdictions are given in Annex-III. An overview of risk management measures adopted in some of the major overseas exchanges/clearing houses for extended trading window is given in Annex - IV. 2.1. The Reserve Bank regulates money markets, Government Securities (G-Sec) market, foreign exchange (Forex) market and the markets for derivatives on interest rate, currency and credit derivatives. These markets have evolved in last 10-15 years in terms of participation, liquidity and venues of trading etc. Most of these markets are dominated by institutional players and corporates with low participation from retail participants. Technology has helped in further deepening of these markets, with most of the trading volumes in overnight money market and G-sec market now carried out on electronic platforms. This chapter discusses, in detail, the structure of each of these markets. Foreign Exchange Market 2.2. Forex market in India is predominantly a wholesale market, dominated by banks, forex brokers and corporate clients. Customers are priced off-market by banks. Trading in forex and related derivatives takes place OTC as well as on exchanges. Forex market is largely an OTC market with an average daily volume of about USD 33 billion. Exchange traded forex derivatives have an average daily volume of about USD 8 billion (Chart 2.1).  2.3. In the interbank market, spot trading is the dominant segment with a share of over 50 per cent in total turnover followed by swaps (Chart 2.2). In the client segment, forwards constitute about 58 per cent of total turnover, followed by spot at 42 per cent (Chart 2.3).  2.4. Major trading venues for interbank spot market are Reuters D2 and FX Clear, while forex swaps are largely transacted outside platform on a bilateral basis. However, almost all settlement in USD/INR markets (about 90-95 per cent) is guaranteed by CCIL. 2.5. Spot trading market is well distributed through the day, while in case of forex forwards, volumes typically increase gradually during the day, with the last two hours having relatively higher volumes (Chart 2.4).  Exchange Traded Currency Derivatives (ETCD) Currency Futures and Currency Options, are traded on all three domestic exchanges (NSE, BSE and MSEI). Distribution of volume and open interest (OI) of currency futures across the exchanges is given in Charts 2.5 – 2.6. Participants in the ETCDs market are majorly institutions and are categorized as Proprietary Traders (Banks and Non-bank), Client and FPIs. Distribution of trading volume and OI for different categories of participants are given in Charts 2.7 – 2.8. Average daily volume in ETCDs is about USD 8 billion.  Money Market 2.6. Overnight money market in India includes the call money market, tri-party repos (TREPS)1 and market repos (Chart 2.9). The call money market trades bilaterally as well as on an electronic platform, Negotiated Dealing System (NDS) – Call, managed by Clearing Corporation of India Limited (CCIL). Likewise, in market repo, trading takes place bilaterally as well as on an electronic trading platform – Clearcorp Repo Order Matching System (CROMS). TREPS is traded entirely through an electronic dealing platform.  2.7. TREPS accounts for about 60 per cent of the total daily trading volume, while the call market contributes about 10 per cent of the volume (Charts 2.10 and 2.11).  2.8. Participation across the three overnight markets varies. The call money market is purely an inter-bank market with the sole exception of primary dealers (PDs). Mutual Funds are the major lenders in TREPS (about 65 per cent of average daily lending). An overview of category-wise participation in the three segments is provided in the following charts (Chart 2.12 – Chart 2.17). 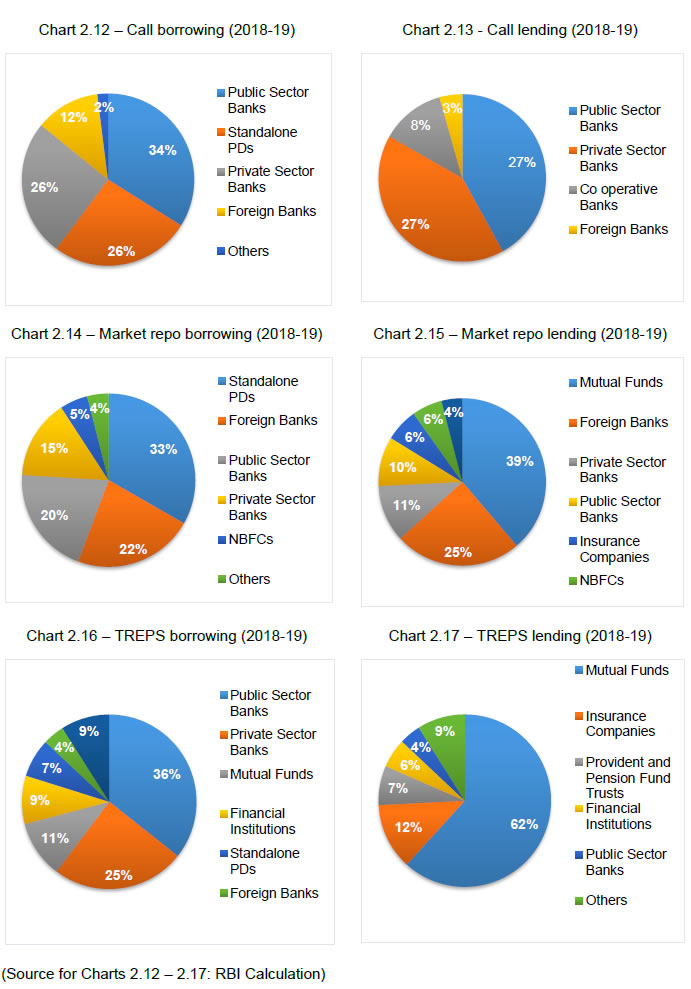 2.9. There is variation in hourly trading volumes as well. Call market and repo are active during the first hour of trade while TREPS sees concentrated trading during the last hour of trading for members settling through DSB. An overview of average hourly trading activity across all the three segments is provided below (Chart 2.18).  Government Securities Market 2.10. Over the last two decades, the government securities (G-Sec) market has witnessed significant changes like introduction of an electronic screen-based trading system, dematerialised holding, straight through processing, establishment of the CCIL as the CCP for guaranteed settlement, new instruments, changes in the legal environment, etc. These changes have contributed to a rapid development of the market. 2.11. G-secs are currently traded on the Negotiated Dealing System – Order Matching (NDS-OM), or bilaterally in the OTC market. The NDS-OM platform contributes around 81 per cent of the total value of transactions, the remaining being in the OTC market (Chart 2.19).  2.12. Central Government dated securities (CGs) form a dominant share (around 88 per cent) in the total trading volume, followed by Treasury Bills (T-bills) and State Development Loans (SDLs) (Chart 2.20). 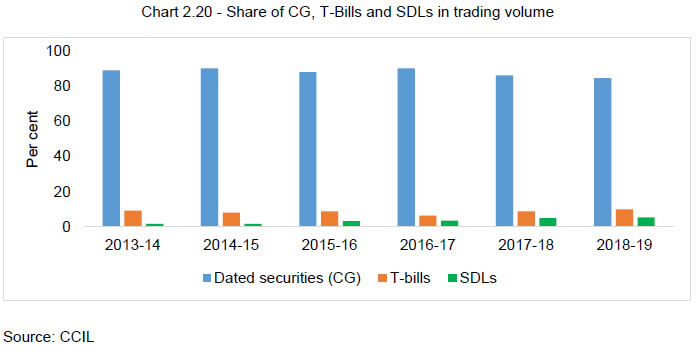 2.13. Primary Dealers and banks are the major participants in the Government securities market. The market share of participants is shown below (Chart 2.21 – Chart 2.22).  2.14. An overview of average hourly trading activity for 3 months is provided below (Chart 2.23). 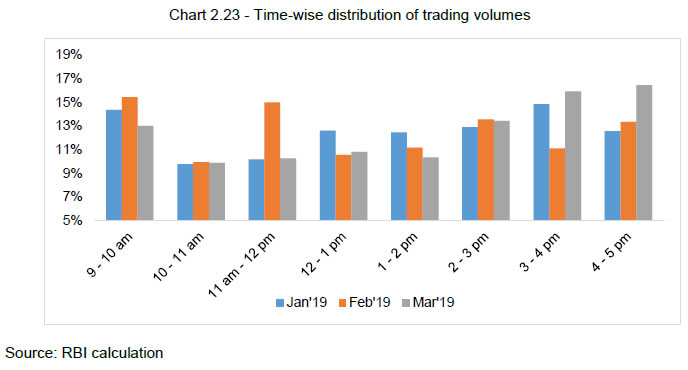 Settlement Mechanism in G-Sec, Market Repo, TREPS and Forex Market 2.15. Call is settled bilaterally through RTGS, throughout the day. All secondary market transactions in Government Securities, market repo and TREPS are settled through CCIL which acts as a central counterparty (CCP). CCIL also acts as a CCP for the forex markets. (Chart 2.24 – 2.25).   3.1. While the decision of market timings is best left to market participants, there is a need to review market timings across all products and funding markets to ensure that they complement each other and thereby avoid unanticipated frictions. Further, extension of trading hours would depend on availability of an efficient and adequate support infrastructure in terms of trading, clearing and settlement. Issues like margin calls, posting of margins, line of credit etc., in an extended market timing scenario need to be considered. Since major payment systems in India (RTGS and NEFT) are available till 7 pm and funding markets (call, TREPS and repo) are all closed by 5 pm, any unanticipated margin calls or funding requirement beyond 5 pm could pose a challenge to the cash and risk management of exchanges or market participants. Similarly, it will have cost implications for various stakeholders such as banks, brokers, custodians, regulators etc., in terms of availability of infrastructure and manpower. This section discusses in detail the various aspects relating to extension of market timings, their implications, and the possible path ahead. 3.2. Foreign Exchange (Forex) Market Current Forex Market Timing 3.2.1. FEDAI has stipulated market timings for inter-bank USD/INR forex transactions from 9 am to 5 pm2 (Table 3.1). However, Authorised Dealers3 are permitted to accept retail transactions beyond these timings. There are no restrictions on timings for transactions in cross currencies. Banks can decide the trade timings based on their internal policies. Broad Objectives of Market Hours 3.2.2. Market hours should facilitate two objectives:
Need for Review of Timings 3.2.3. A comprehensive review of timings in the forex market is considered desirable for the reasons discussed here. 3.2.3.1. Increased volume in offshore markets: Gradual integration of the Indian economy with the global economy and increased interest of foreign investors in Indian markets aided by a liquid USD/INR forex market, have led to growing volumes in Rupee trades in the offshore markets. Volumes in the offshore currency futures markets, have steadily increased during last 3-4 years vis-à-vis on-shore exchanges (Chart 3.1). Market share of domestic exchanges in USD/INR futures has come down from about 74 per cent in 2014-15 to 56 per cent in 2018-19. Similarly, offshore markets for non-deliverable forward (NDF) in financial centres such as Singapore, Hong Kong, Dubai and London have seen sizable growth and, as per BIS Triennial Survey 2016, NDF turnover stands at about USD 16 billion on a daily basis. Several enablers such as ease of capital flows, conducive tax environment, operational/ administrative convenience, enabling regulatory environment (onboarding of investors, product design and offerings) longer trading windows, etc., have facilitated growth of NDF markets in various currencies in international financial centres. Offshore markets provide several advantages over onshore markets. The capital control regime requires that entities with Rupee exposure can access the onshore market for hedging. Even for hedgers, administratively, there is a natural incentive to operate in the offshore market so as to leverage their existing settlement as well as collateral arrangements through centralised treasuries. Product related restrictions in the onshore market e.g., swaps and structured options are not allowed to non-residents for hedging, may also limit the product choices for non-resident. Offshore Rupee derivative market is virtually a 24 hour market and, therefore, non-residents have the flexibility to execute and unwind hedge contracts during their working hours. However, onshore market timings may not be a suitable window as per their time zone. Thus, the ability to dynamically manage risk in the offshore market, makes NDF markets attractive for non-residents. Apart from this favourable tax laws may also be an important determinant in choice of trading market. 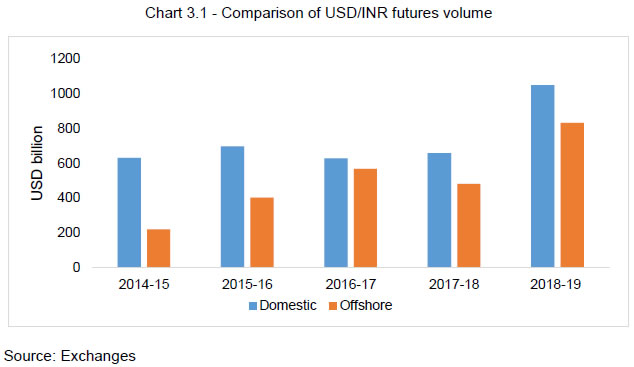 3.2.3.2. Longer trading window in offshore markets: Total investment by Foreign Portfolio Investors (FPIs)/Foreign Direct Investors (FDIs) in India has grown significantly in the last 15-20 years. However, onshore hedging activities of non-residents have been low with forward outstanding currently at around USD 6 billion as compared to the investment at USD 80 billion. There is a possibility that non-residents prefer offshore markets to hedge their Rupee risk, because of centralised treasuries, ease of regulatory and taxation requirements, non-availability of onshore markets during their time zone, etc. Trading hours of onshore forex markets, especially the exchanges, are shorter in comparison to offshore exchanges which offer Rupee contracts (like DGCX, SGX, CME, ICE, etc.) (Table 3.2). These exchanges are located at major financial centres and offer a variety of products. Incidentally, although Rupee trades for 17-23 hours on these exchanges, the majority of the volume (72-87 per cent) takes place during Indian trading hours (Table 3.3). The current market hours for USD/INR spot/ forward/ options, starts at 9 am and closes at 5 pm, with customers being able to access the USD/INR market till 4:30 pm. These current timings overlap with the trading hours of Asian markets (including their closing) as well as first half of a European trading day. This allows Indian markets to have a reasonably good price discovery based on news in global markets during these hours. There are, however, some market hours, especially the US market opening (after India closes) and Asia opening (before India opens), during which the Indian markets are shut, which have a bearing on the prices in Indian markets. Further, domestic OTC markets in most economies have regulated market hours and a review of the spot market timings data for emerging Asian economies indicates that the trading hours vary in the range of 6-9 hours (Chart 3.3). Indian forex markets remain open for 8 hours which is similar to most Asian markets. Even in case of major currencies (G-10 currencies) which are traded 24 hours across the globe, domestic markets in each country are open for a limited time period and activity is transferred from one place to another. For instance, activity for EUR/USD, for an internationally active bank, would shift from its London desk to NY desk after close of trading (in London). Further, as mentioned earlier, USD/INR volumes on the off-shore exchanges are also concentrated during Indian trading hours. As a corollary, any extension of domestic market hours might lead to higher volumes in off-shore exchanges.  3.2.3.3. Onshore markets fail to capture major international events: Domestic markets are closed during important currency trading sessions such as New York time and Tokyo time. Hence, any major domestic or international event or data release during hours when the Indian markets are closed, are not priced in by the residents and this may impact the opening rates of the Rupee. In extreme cases, it may manifest in a gap-up or gap-down at market opening, on the next day. While traders in offshore markets are able to price the information as and when it is released, an onshore trader is at a disadvantage. Commodity hedging market in India operates till 11.30 pm and hence prices in international developments completely. This enables commodity hedging domestically, but the corresponding currency exposures remain unhedged as forex market is closed. As seen in Chart 3.2, the opening price of USD/INR (near month contract) on NSE is generally closer to the previous closing price on DGCX than the previous end of day price on NSE. This is understandable as trades in DGCX price in information generated after NSE closes. Quick and effective assimilation of information is likely to make markets more efficient in terms of price discovery, reduction in volatility and impact cost. However, based on a study spanning the period from 1998 to 2018, the average intra-day volatility (Closet+0 – Opent+0) is 13 paise while the average overnight volatility (Opent+1 – Closet+0) is 6 paise. More significantly, there are substantially more days of high intra-day volatility than high overnight volatility. Roughly, 85 per cent of exchange rate volatility occurs during domestic market hours; perhaps even more because off-shore volatility is exaggerated due to relative illiquidity post Indian trading hours. 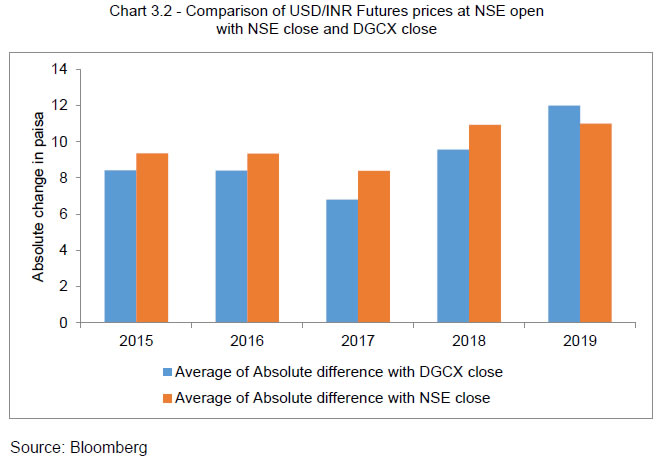 3.2.3.4. Offshore NDF markets impact on onshore price: Over a period, regulations have been liberalised to permit Rupee invoicing of trades, Rupee borrowings under the External Commercial Borrowings (ECB) route, issue of Masala Bonds, centralised hedging etc., which have increased Rupee exposure of non-residents. There is evidence that onshore exchange rate, especially in times of volatility, is guided by the price movements in offshore markets. A 2013 RBI working paper4 on inter-linkages between onshore and offshore NDF markets shows that when Rupee is appreciating, there is a bi-directional relationship between the two markets, while there is a unidirectional impact of NDF market on onshore market when the Rupee is depreciating. The results indicate that with increasing volumes of NDF market, the rupee is likely to become more prone to shocks emanating from overseas markets. The Group also carried out an empirical analysis to assess the impact of NDF closing prices on the forex opening prices in the domestic market for the period 2010 – 2018 (Annex I). The assessment indicated a strong bi-directional causality between NDF prices and onshore forex prices, which is statistically significant. The dynamic relationship between the NDF closing prices and domestic forex opening prices are also estimated through an unrestricted vector auto regression (VAR). The estimated impulse response shows that a one standard deviation shock in NDF closing prices results in an increase of about 22 basis points in forex opening prices on the following day which gets muted after one day and peters out thereafter. Extension of domestic market timings could help domestic markets to become less prone to external price fluctuations. However, for this to happen, along with extension of market hours, other complementary measures which are underway viz. flexibility to non-residents to access onshore interest rate market and forex hedging markets, need to be expedited. Impact of Extension of Trading Hours 3.2.4. Impact of extension of trading hours, primarily for USD/INR trades, are discussed here. 3.2.4.1. Impact on price discovery Advantages a) Globally, OTC forex markets in major currencies (G10 currencies) are open round the clock. The growing volumes in Rupee on offshore exchanges (Chart 3.1 above) indicate that there is reasonable offshore demand for Rupee exposure. Further, internationally forex markets are quite active when New York and London times overlap, but the domestic Rupee market is closed during these hours. Extension of trade timing could help in effective assimilation of international developments and help make the domestic markets less prone to the to external price fluctuations in Rupee. This would also imply effective exchange rate management policy. b) Prices would reflect significant developments during extended hours enabling domestic entities to manage risk more efficiently. Disadvantages a) There could be less informed price discovery during extended hours due to lower liquidity and lower number of active market participants. b) Efficient pricing in futures markets requires live spot market in the underlying. If the OTC market is closed, inefficient pricing and their illiquidity could lead to volatility, price overshoots and the associated costs. c) Keeping the spot market open would involve costs for participant banks, brokers etc. It may also require that the funding markets are kept open, further raising market costs. All these cost increases, since they are eventually passed on to customers, raise the cost of market access in the long run. 3.2.4.2. Impact on Cost Advantages a) Though there will be initial costs, there are long term benefits in terms of market development. Banks may minimise the cost through review of process flows, centralisation of activities, etc. Banks may decide to participate in extended trading hours based on their internal policy. Further, with improved liquidity in the market over time, the costs may get reduced. Further, calibrated extension may help in limiting costs to some extent. Disadvantages a) Any extension of trading hours could entail costs for various banks, brokers, custodians, regulators, etc. in terms of infrastructure, back office processing and human resource. Not only Treasury Front Office, but various other supporting departments of banks (e.g. Clearing, B/O, M/O, Trade Finance, IT) may need to remain open during extended hours. There could be a need for keeping the branches open to process the documentation and related activities. The attendant costs could outweigh the benefits. A similar analysis by Tokyo Stock Exchange (TSE) suggested that the early opening or extension of trading hours may have higher cost than benefits. Thus, TSE reduced the noon recess to allow additional trading time instead of extension of market timing. (Annex III). b) .(To be discussed) The extent of additional cost due to extended business hours could not be quantified. However, as per market feedback, extension may not have benefits commensurate with increase in costs, at least initially. 3.2.5. Proposals for domestic Forex market timings 3.2.5.1. Discussion with market participants indicate that market has a mixed view on the benefits of extension in market timing. While, the large corporates believe that extension in market timing may enable them to manage their risk efficiently, the smaller corporates appear to be indifferent to the same. The feedback from banks, which are the major market makers, is also not unanimous. Some of them believe that extension in market timing need not impact volumes substantially and may lead to spreading of the volumes across extended hours. Extension in market timing could entail higher infrastructure cost to stakeholders, viz., banks, brokers, exchanges and regulators. With, most of the turnover in offshore exchange traded rupee derivative market taking place during onshore market hours and limited market hours in most of the other emerging markets, suggests that any extension in market timings needs to be calibrated carefully. As discussed in para 3.2.3.1, though several factors contribute to growth in NDF markets, availability of longer market hours is one of the major determinants. The current forex market regulations are being reviewed and rationalised to allow greater flexibilities to both residents and non-residents in terms of products choice, positions, purpose and participation etc.. Recently the Reserve Bank has also constituted a Task Force to examine the offshore Rupee market and recommend measures to incentivize the non-residents to hedge in the onshore market. It is felt that extension in market timing will complement these policy measures aimed towards improving access to onshore markets and better position onshore markets vis-à-vis offshore markets in terms of efficiency, liquidity and price discovery for non-residents. This assumes importance as growth in the external sector and increased internationalisation of rupee, likely to increase trading interest and investor base in Rupee going forward. This is evident from introduction of Rupee products in several offshore exchanges. Extension of market timings may enable shift of some of the offshore volumes to onshore markets thereby improving domestic market liquidity, if not immediate but over medium to long term period. Experience from some of the exchanges viz., Hong Kong Exchange (HKEx), points to positive impacts on the volume on account of extension of market timing. Further, from the perspective of residents, the benefits could be in form of improved price discovery, reduction in volatility during opening hours, efficient hedging, etc., due to improved assimilation of international development. Better price discovery coupled with improved liquidity over a medium to long term horizon, may allow domestic market prices to become less prone to external price fluctuations in Rupee. It is therefore desirable to explore calibrated opening of markets to gauge demand and potential benefits. 3.2.5.2. Markets segments to be extended: Clients generally prefer the OTC market for hedging their risks as it gives flexibility in terms of size and tenor of contracts. The IWG examined the potential issues of extending the timing of exchanges only, leaving the OTC market unchanged. It is operationally easier to extend timings on exchanges as they already have some segments open in extended hours. However, longer market timings for currency futures over OTC (spot) market will create asymmetry between the underlying market and the futures market, which could possibly lead to higher volatility during the non-overlap timing. This is because in the absence of OTC (spot) markets, the price discovery in futures market could be purely based on the trading interests of entities dealing in extended hours. Such prices therefore may not be a true reflection of the underlying interest. Similarly, while the future market would rapidly converge to the spot plus carry at the next spot open, when the spot market resumes its role as a price setter, it could still influence the opening on the next date. Further, banks are active participants on both - exchange and OTC currency markets; they hedge their economic positions in both OTC (options and forwards) and exchange traded (futures and options) segments within the assigned limits. Extension of exchange timings without corresponding extension in the OTC market could subject overnight positions of banks to excess valuation changes. Besides, the presence of customers, sensitive to volatile prices, would ensure that the banks stay active on exchanges also. Therefore, it is desirable to extend trading hours for both OTC and Exchanges. 3.2.5.3. Preferred revised timings: In the event of extension of forex trading hours, the trading hours may be such that they cover EU and US sessions’ overlap as this will facilitate to sufficiently capture movements in European markets and part of US markets (Table 3.4). This would also be beneficial from the perspective of limiting infrastructural costs, human resource cost and administrative costs. IWG was of the opinion to extend the OTC forex and exchange traded currency derivatives markets till 9 pm. 3.2.5.4. Need for aligning corporate and inter-bank trading hours: Currently, inter-bank trading hours in USD/INR are longer than customer window by 30 minutes (till 5 pm). This arrangement has worked well for banks. The Reserve Bank has been receiving suggestions to allow banks to extend USD/INR trading window to corporates beyond 4.30 pm. The IWG explored the feasibility of aligning inter-bank and customer window. Banks are of the view that the gap between inter-bank and customer window is needed to cover customer positions in the inter-bank market. Banks will find it difficult to cover, in case there are large customer transactions at the closing moments of market. Further, this window allows banks to manage NOPL and regulatory requirements. Hence, banks are of the view that for efficient management of risks, inter-bank trading hours should be slightly greater than the customer timings. In several jurisdictions there is no gap between inter-bank and customer window. Currently also, AD banks are permitted to accept retail transactions in USD/INR beyond 5 pm. There are no time restrictions for transactions in cross currencies. However, the market may still force banks to a uniform time-line as customers may shift to banks with larger trading window. The IWG suggests that the current structure of client and inter-bank timings - i.e. longer inter-bank timings by 30 minutes - may be continued as this window allows banks to manage their risks. 3.3. Money Market Current money market timings 3.3.1. Timing of overnight money markets is provided in Table 3.5. Cross Country Comparison 3.3.2. For many other Asian economies, like Indonesia, Malaysia, South Korea and Hong Kong, interbank money markets are open till about 4 pm to 6:30 pm (local time), akin to that in India. The cut-off timings for payment systems (for customer transactions), in many of these jurisdictions, is before closure of money markets. However, in certain jurisdictions, including China, Thailand and Vietnam, retail payment systems remain open post closure of money markets. Review of timings 3.3.3. The committee reviewed the money market timings from the perspective of – 1) alignment of timings across various segments; 2) alignment of timing for members settling at RBI and members settling at DSBs; 3) intraday liquidity challenges due to sequencing of settlements; and 4) challenges for benchmark calculation. Alignment of timings across various segments 3.3.4. It is desirable that the various segments of money markets remain open for a similar time window so that participants have options to access collateralised or uncollateralised funding as per their need. It may also alleviate pressure on any particular segment that remains open after closure of other market segments, which could happen in case of separate timings for different funding markets. However, different settlement mechanisms for collateralised (market repo and TREPS) segments and uncollateralised (call) segment pose challenges in alignment of timings. The settlement of transactions in market repo and TREPS takes place along with secondary market transactions in securities segment. Multilateral netting of funds and securities results in high degree of netting benefits for market participants in terms of liquidity requirement. Further, sufficient time is also required after completion of securities settlement so as to facilitate market participants to repay their intra-day credit lines availed from banks. Thus, availability of large value payment systems, such as RTGS, is essential for efficient functioning of the collateralised funding markets. Currently, funding markets in India remain open for about six to eight hours, which is comparatively on par with most emerging Asian economies. However, with the extension in customer RTGS timings till 6 pm and collateralised funding markets available till 3 pm, high value customer payments may entail liquidity management issues for banks. Extension of RTGS customer window provides scope for extension of collateralised money markets. Taking into account the need for settlement in collateralised segment prior to closure of RTGS customer window, IWG suggests that market repo and TREPS may be extended till 4 pm. As call market transactions are settled bilaterally through RTGS, extension would not require any modifications in the supporting payment and settlement systems. Hence, IWG recommends that the call market timings may be extended till at 6 pm co-terminus with RTGS customer window, by which time high value payments are expected to get over. Banks may manage unanticipated their liquidity, post 6 pm, by accessing RBI’s MSF window or reverse repo facility. Alignment of timing for members settling at RBI and members settling at DSBs 3.3.5. Market repo and TREPS close at 2:30 pm and 3 pm respectively. However, entities settling their fund positions at Reserve Bank have an additional 30 minutes in the TREPS market beyond 2:30 pm. To increase synergy between the collateralised funding segments, timings for all participants may be aligned. Alignment in timings may, however, pose some operational challenges in current DSB structure. Thus, IWG recommends that the current difference in timings for DSB members may be continued. This may be reviewed once clearing member structure is introduced by CCIL. Intraday liquidity challenges due to sequencing of settlements 3.3.6. Primary auctions and OMOs settle at about mid-day while securities settlement takes place at the end of the day. This sequencing of settlements may increase the intraday liquidity needs of the system as some market participants may have payable position in one settlement and receivable in another. Hence, IWG recommends that settlement time of primary auction/OMO may be shifted from current (around 12 pm) to a later time (afternoon) of around 4 pm. Alternatively, the option of merging the settlement for OMOs (non-guaranteed basis) with that of secondary market in G-sec (guaranteed), may also be explored by taking into account various legal and operational issues. This would help in reducing the overall liquidity requirement and improving the netting efficiency. Challenges for Benchmark Calculation 3.3.7. Secondary market trading in Commercial Papers (CPs) and Certificate of Deposits (CDs) take place OTC and are reported on CCIL’s F-TRAC platform. Currently, Financial Benchmark India Private Ltd (FBIL) calculates the benchmark rates for CDs and takes the cut-off time as 5 pm. To streamline benchmark rate calculation, cut-off time for CP, CD secondary market trading should be fixed at 5 pm, thereby aligning it with other segments. FBIL may be accordingly advised to take trades reported till 5:15 pm on the F-TRAC platform for benchmark rates calculation. 3.4. Government Securities Market Current G-Sec market timings 3.4.1. Currently, the dealing hours for the secondary market transactions on NDS-OM and OTC are from 9 am to 5 pm for all the members and the settlement is usually on T+1 basis (FPIs are permitted to settle on T+1 or T+2 basis). Settlement is completed by 4 pm on DvP III basis. Settlement of primary auction and OMO takes place in RBI at about 12 pm. Daily trading volumes are well distributed during the day with slightly higher share in the first and the last hour of the trading. Trading data for (old) 10-year benchmark (7.17 per cent GS 2028) for the month of March 2019 is as below (Table 3.6). Cross Country Comparison 3.4.2. IWG examined the G-sec market trading hours in other comparable Asian markets. The current trading hours in Indian markets are comparable, or longer compared to the trading hours in some of these Asian bonds’ markets. Interestingly, some of the markets have an intraday break in between (Table 3.7). Review of Timings Review of G-sec market was undertaken mainly from the perspective of 1) better integration of market moving news/information and ease of participation for non-residents in G-Secs, 2) impact of ND-OIS prices on on-shore prices and 3) Occasional requests for permitting T+0 settlement for secondary market transactions. 3.4.3. Major data in respect of US market (NFP data, FOMC minutes, etc.), which lead to movement in treasury yields, are released post the closing of domestic G-Sec market. Current market timings do not allow market participants, especially the FPIs, to adjust their investments immediately based on the news/events in international markets. Further, there is a growing non-deliverable overnight indexed swaps (ND-OIS) offshore market, which may influence the onshore market. Empirical study by the IWG indicated that there is a strong unidirectional causality from ND-OIS closing rates to domestic opening rates. On settlement side, there have been occasional requests to permit T+0 settlement for secondary market transactions which may facilitate funding unanticipated requirements. 3.4.4. There have been no requests from any market participants seeking extension of market hours for G-sec trading. Most of the FPIs investing in India already have Asian base and therefore extending the timings may not lead to larger volume. The feedback from the market is that current timings are more than adequate. Therefore, IWG recommends to retain the current market timings. 3.4.5. T+0 transactions can be supported by NDS-OM platform and may be undertaken. But, introduction of T+0 settlement on the NDS-OM platform may result in fragmentation of the liquidity between segments. This may impact the pricing of the securities and result in wide bid-ask spreads. However, the committee discussed exploring the feasibility of allowing market participants to transact in G-sec on T+0 basis on DvP 1 mode for meeting their funding requirement. This facility could be provided by linking the securities settlement system (e-Kuber) and RTGS. 4. Impact on clearing, settlement and risk management 4.1.1. Post-trade services like clearing and settlement play a crucial role in ensuring that the obligations on account of entering into a trade are properly discharged. Further, the risk management systems and processes are integral in eliminating (or minimising) risks associated with trading. This chapter examines the impact of the recommendations by the IWG on underlying post-trade and risk management processes and systems. 4.1.2. Forex market 4.1.2.1. The revised forex market timings as recommended by the IWG have been provided in Table 4.1. 4.1.2.2. In the OTC segment, as the deals during the extended hours would be for value date Tom and beyond, there would be little impact on current settlement process. However, extension in market timings will lead to corresponding increase in CCIL’s (CCP’s) day end processing like MTM valuation and margin calls etc. As supporting payment systems will not be available during this extended hours, CCIL will be required to review its risk management framework and processes, especially those relating to margin calls. 4.1.2.3. Exchanges may also have to suitably amend their settlement systems to tackle longer hours. Exchanges with longer trading hours, like HKEx (Annex III), consider trades executed during the extended hours as T+1 trades which are cleared and settled the following day. Currently the clearing house of exchanges levy initial margin and other margins at the time of transactions. Margins on a portfolio client level are computed on a real time basis and adjusted from the collateral of clearing members. Post extension of timing, margin requirement for portfolio change may have to be planned in advance and provided by the clearing members, as payment systems (NEFT and RTGS) will not be available post 7 pm. 4.1.3. Money market 4.1.3.1. The group has recommended extension of timings for both collateralised and uncollateralised segments of the money market. The revised timings, along with the current timings are provided in the Table 4.2. 4.1.3.2. Extension in timing for collateralised segments of the money market, for T+0 settlement, will concurrently extend the entire securities settlement process. Settlement process, which currently gets over by 4:00 pm currently, will be completed by around 5:00 pm, post extension. However, the availability of large value payment system (RTGS), till 6:00 pm, will ensure that members availing intraday credit lines, from settlement banks, have an hour (5:00 – 6:00 pm) window to close those lines. 4.1.3.3. Further, extension of call market timings (to 6:00 pm) will not require any modifications in the supporting clearing and settlement systems, since transactions are settled bilaterally through interbank RTGS. As call market is uncollateralised, risks arising from counterparty exposure is borne by members. Hence, no additional risks will arise only because of extension in timings. 4.1.3.4. The group has recommended that settlement time of Primary auction/OMO may be shifted from current (around 12:00 noon) to a later time (afternoon) of around 4:00 pm. Settlement of OMO is on DvP basis. Thus, in case a counterparty fails to deliver the securities/funds, it will be excluded from the settlement process. Hence the change in timings may not require any system changes. 4.1.4. G-sec market The group has not recommended any revision in timings for the G-sec market. 5.1.1. Forex market 5.1.1.1. As discussed in para 3.2.5.1, market has mixed views on the benefits of extension of market timing. While the extension of market timings is expected to provide benefits such as better pricing of post market hours information/data, improved onshore price discovery, and possible shift of offshore volumes to onshore, there is a view that it may entail higher costs to stakeholders. However, since RBI is in the process of reviewing and rationalising foreign exchange regulations to provide flexibility in terms of choice of products, participation, positions, etc., both for residents and non-residents, extension of market hours would complement these policy measures. Thus, calibrated extension of market hours, and to begin with revised market timings of 9 am - 9 pm, may be considered to gauge demand and potential benefits. (Para 3.2.5.1 and 3.2.5.3) 5.1.1.2. It is operationally easier to extend timings on exchanges as they are already offering extended market hours for commodity and derivative segment. However, foreign exchange market in India is predominantly over-the-counter (OTC) and hence prices in thinly traded exchanges could be more volatile in the absence of OTC market. Extension of exchange timings without corresponding extension in the OTC market could pose risk management issues (valuation and open position) for banks operating in both markets. Therefore, it is desirable to extend trading hours for both OTC and Exchanges. (Para 3.2.5.2) 5.1.1.3. Timings for both inter-bank and client segments may be extended and the current gap of 30 minutes between inter-bank and client segments may be maintained to allow banks to manage their risks. (Para 3.2.5.4) 5.1.2. Money market 5.1.2.1. With extension in RTGS customer window till 6:00 pm, the timings for collateralized money market segments (market repo and TREPS) may be extended till 4:00 pm. (Para 3.3.4) 5.1.2.2. Call market timings may be extended till 6:00 pm, co-terminus with RTGS customer window, to facilitate liquidity management by banks. (Para 3.3.4) 5.1.2.3. To increase synergy between the collateralised funding segments, timings for all participants (members settling at settlement banks and members settling at RBI) may be reviewed and synchronised, once clearing member structure is introduced by CCIL. (Para 3.3.5) 5.1.2.4. To reduce intra-day liquidity requirement, settlement time of primary auction/open market operations (OMO) may be shifted from current (around 12:00 p.m.) to a later time (afternoon) of around 4 PM. Alternatively, the option of merging the settlement for OMOs (non-guaranteed basis) with that of secondary market in G-sec (guaranteed), may also be explored by taking into account various legal and operational issues. (Para 3.3.6) 5.1.2.5. To streamline benchmark rate calculation, cut-off time for Commercial Paper (CP) and Certificate of Deposits (CD) secondary market trading should be fixed at 5:00 pm, thereby aligning it with other segments. (Para 3.3.7) 5.1.3. G-sec market 5.1.3.1. The current market timings for G-sec markets may be retained, on account of lack of demand from participants. (Para 3.4.4) 5.1.3.2. The feasibility of facilitating securities transactions on T+0 basis on a DvP I mode may be examined for facilitating funding needs of market participants. (Para 3.4.5) Empirical Results on Market Timings - Impact Analysis5 a) Impact of NDF closing prices on onshore forex opening prices: The empirical exercise to assess the impact of NDF closing prices on the forex opening prices in the domestic market is based on pair-wise Granger Causality tests on daily data with one period lag covering from January 1, 2010 to October 12, 2018. The estimated results reveal strong bi-directional causality, which is statistically significant at 1 per cent level of significance (Table 1).
The dynamic relationship between the NDF closing prices and forex opening prices are also estimated through an unrestricted vector auto regression (VAR). The estimated impulse response shows that a one standard deviation shock in NDF closing prices results in an increase of about 22 basis points in forex opening prices on the following day which gets muted after one day and peters out thereafter. The impulse response function is also statistically significant as it lies within the standard error band (Chart 1). b) Impact of ND-OIS closing rate on onshore G-sec opening rate: A similar exercise to assess the impact of ND-OIS closing rate on the opening yield of benchmark 10-year G-sec paper, based on pair-wise Granger Causality test (on daily data covering from January 2, 2012 to October 12, 2018), reveals strong unidirectional causality (with one period lag) running from ND-OIS closing rate to opening yield of benchmark 10-year G-sec (Table 2).
The strength of the relationship between the ND-OIS closing rate and the opening yield of benchmark 10-year G-sec as estimated from an unrestricted VAR shows that a one standard deviation shock in ND-OIS closing rate leads to a marginal increase of around 1.5 basis points in the opening yield of G-sec the following day, which dies down after three days. This response is also found to be statistically significant (Chart 2). Literature Survey Several studies exploring the impact of periodical market closures suggest that such closure may induce delay in incorporation of information into stock prices, which can widen the divergence between stock prices and fundamental values (price efficiency). It may also cause excessive volatility in stock returns on an intra-day basis, especially at the beginning and end of the trading session (Kyle, 1985; Glosten and Milgrom,1985; and Easlay and O’Hara, 1992). Moreover, a skewed trading pattern in NASDAQ i.e., high trading volume – especially at the open and close of the regular-hours – calls for extension of trading hours to mitigate market inefficiencies (Jain and Joh, 1988). Furthermore, it is found that trading after regular business hours introduces noise resulting in higher bid-ask spreads and inefficient price discovery. Thus, announcements after market hours are likely to generate greater price volatility (Barclay and Hendershott, 2003). Case Studies related to Extension
Global Case Studies - Risk Management during Extended Trading Window Forex Futures in EUREX Rationale for extended hours Forex trading takes place around the clock worldwide, starting on Monday morning New Zealand time and closing Friday afternoon New York time. In order to offer a competitive trading environment, EUREX has extended the trading hours to cover a trading time of 23 hours. Forex futures market was extended in Feb 2017 and forex options market was extended with effect from 2 July 2018. Clearing and risk management Calculation of initial margins for forex futures is unaffected and completely integrated into the margin methodology called Eurex Clearing Prisma. Margin offsets will be granted between forex options and forex futures within the same liquidation group. Margin figures for Clearing Members who are exposed to forex products are calculated as well between 00:00 and 07:00 CET in the morning. During this time span, Eurex Clearing will issue margin reports to the affected Clearing Members on a 10-minute interval showing the margin shortfall and surplus. Clearing Members who are actively clearing forex futures should be aware that the Intra Day Margin call process is applicable during the complete trading day. Margin calls issued between 00:00 and 07:00 CET can be fulfilled using cash payments in Australian dollars. Margin settlement Margin calls are always called against the Clearing Member. However, margin calls arising from shortfalls on client accounts are calculated separately, with auto allocation of the cash collateral received to the client collateral pool. For cash collateral under all clearing models, the Clearing Member’s existing payment infrastructure may be used. All Clearing Members should have access to a USD account for late margin calls. Intra-day margin settlement If there is a margin shortfall on a client account under a Clearing Member, Eurex Clearing will issue and process individual margin calls for the collateral pool in which the margin shortfall has occurred. Eurex Clearing may issue an intra-day margin call between 7:00 CET and 22:30 CET. Once an intra-day margin call has been issued, the Clearing Member has 30 minutes to:
If no action is taken within the 30 minutes then Eurex Clearing will automatically instruct a debit against the Clearing Member’s cash account. If the margin shortfall is a result of a shortfall from a client account, then the cash will be automatically allocated to the segregated pool in which the shortfall occurred. End of day margin settlement: Eurex Clearing’s system closes at 22:30 CET and any overnight margin shortfalls are automatically debited the following morning. Auto-debits are instructed by 07:00 CET and must be funded at the latest by 08:00 CET for EUR and USD and by 09:00 CET for CHF and GBP. If the margin deficit is a result of a shortfall from a client account, then the cash will be automatically allocated to the segregated collateral pool in which the shortfall occurred. Credits are instructed thereafter, 08:00 CET for EUR and USD and 09:00 CET for CHF and GBP. Proposed Extension of Market Eurex plans to extend its trading and clearing hours for selected equity index, fixed income and MSCI futures into the Asian time zone starting from 10 December 2018. Brief on Risk Management for the same is given below: Existing procedures for Clearing Members shall remain unchanged as far as possible. Overnight margin calls will continue to be debited in the European morning. Moreover, the overnight margin calls will be considered as fulfilled during the extended service hours, i.e. each collateral pool starts into the extended service hours without a shortfall. An intra-day margin call during the extended service hours shall only be issued under the following conditions: a. in case of positions changes during the extended service hours due to trading and/or clearing activities (e.g. position transfer, Give-Up/Take-Up etc.) and b. when the intra-day risk limit of the Clearing Member is exceeded (10 percent of the Clearing Member’s Total Margin Requirement). In case an intra-day margin call needs to be fulfilled during the extended service hours, U.S. dollar (USD) and Australian dollar (AUD) are offered as currencies to cover such margin call. Already existing USD payment infrastructures can be utilised. Initially, it will not be possible to provide securities collateral during the extended service hours. Source: i. EUREX Circular6 ii. EUREX Website7 SGX Clearing Process SGX-DC (SGX Derivatives Clearing) runs a settlement cycle for all derivatives products daily. During the settlement cycle, margins for outstanding positions are calculated. To reduce SGX-DC’s exposure to intra-day price changes, SGX-DC performs 3 intra-day margin cycles daily: - once in the late morning and once in the afternoon for current day trades and positions; and - once immediately after the end-of-day settlement cycle that includes trades for next day clearing. At each intra-day cycle, trades and positions are marked-to-market and margin requirement re-calculated. The computed profits and losses for futures and OTC swaps, and premium for option trades are collateralized together with margin requirement. At the end of each clearing cycle, SWIFT debit instructions are sent to SGX-DC’s settlement banks to debit Clearing Members’ accounts for margin calls. Settlement banks are required to confirm the banking instructions within a stipulated time via SWIFT. SWIFT system facility is also available after closure of banking hours. Source: SGX website8 Note - on SGX website, after opening the link above, please check the “Clearing Process” option provided. Risk management arrangement for After Hours Trading (AHT) at HKEX In the absence of a level of banking support to facilitate intra-day call capability during the T+1 Session similar to that during the T Session, the following additional risk management measures will be implemented to mitigate the counterparty risks associated with AHT. Perform monitoring of CPs’ net capital-based position limit (CBPL) based on both the current market prices and positions at regular intervals during the T+1 Session, supplemented by ad-hoc CBPL monitoring. CPs breaching their CBPL will be requested to reduce their exposure to ensure their CBPL compliance. CPs may be disconnected from the HKEX trading system and subject to closing out action by HKEX should they fail to comply with such request or further increase their exposure. A mandatory variation adjustment (VA) and margin call to markets (based on the morning Calculated Opening Prices (COP) or market price shortly after the market open if COP is not available) with T+1 Session will be introduced following the market open of each T Session. Unlike the current ad-hoc intra-day call which includes VA only, this mandatory call will include both VA and margin of all positions as of thirty minutes before the relevant market open of the morning trading session. The call will be issued to CPs by 10:00 a.m. and the payment shall be settled by 12:00 noon. The Calculated Opening Price is the equilibrium market price derived from the price discovery period of thirty minutes before the opening of the morning trading session. There will be no intra-day variation adjustment or margin call during the T+1 Session. Source: HKEX FAQ9 Global Practices Four major overseas exchanges/clearing houses located in USA, Europe and Asia, the mark-to-market and margin of the trades executed during the T+1 Session are in general collected within one day after execution Moreover, it is common amongst overseas clearing houses to conduct multiple variation adjustments and margin calls on their CPs each day. Overseas risk management measures to manage the intra-day risk of afterhours trading vary. Some of the overseas exchanges are able to rely on intra-day call(s) to mitigate the risk as their banking support is still available during their afterhours trading while others impose position limits on their CPs instead as we are proposing to do. Source: HKEX Consultation paper10 1 Refers to CBLO prior to the date of introduction of TREPS (5th November, 2018) 2 Guidelines for ‘Internal Control over Foreign Exchange Business’ dated February 03, 2011 3 Authorised Dealers means a person authorised as an authorised dealer under Sub-section (1) of Section 10 of FEMA. 4 RBI WPS (DEPR): 11/2013: NDF and Onshore Indian Rupee Market: Study on Inter-Linkages 5The appropriate empirical exercise was carried out after testing the stationary properties of the variables under consideration. The Augmented Dickey-Fuller tests reveal that the variables are stationary in first difference (which reflects the returns). 6https://www.eurexchange.com/blob/2732236/a2089515cf52df77c025e858f2c252e9/data/er16087e.pdf 7http://www.eurexclearing.com/clearing-en/collateral-management/margin-settlement 8http://www.sgx.com/wps/portal/sgxweb/home/clearing/derivatives/derivatives_clearing 9https://www.hkex.com.hk/Global/Exchange/FAQ/Derivatives-Market/Trading/After-Hours-Trading-(AHT)?sc_lang=en 10http://www.hkex.com.hk/-/media/HKEX-Market/News/Market-Consultations/2011-to-2015/May-2011-Consultation-Paper/Consultation-paper/cp201105.pdf | ||||||||||||||||||||||||||||||||||||||||
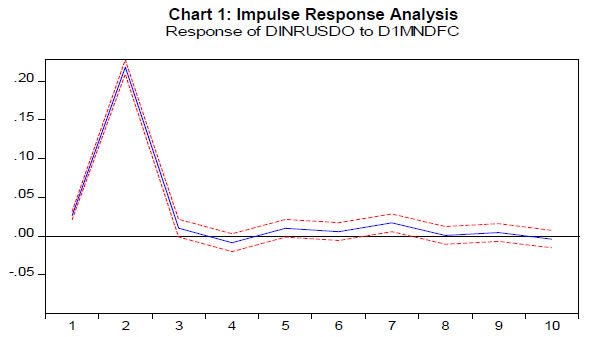


ਇਸ ਪੇਜ ਨੂੰ ਸ਼ੇਅਰ ਕਰੋ:


ਭਾਰਤੀ ਰਿਜ਼ਰਵ ਬੈਂਕ ਮੋਬਾਈਲ ਐਪਲੀਕੇਸ਼ਨ ਇੰਸਟਾਲ ਕਰੋ ਅਤੇ ਨਵੀਨਤਮ ਖਬਰਾਂ ਤੱਕ ਤੇਜ਼ ਐਕਸੈਸ ਪ੍ਰਾਪਤ ਕਰੋ!
ਸਾਡੀ ਐਪ ਇੰਸਟਾਲ ਕਰਨ ਲਈ QR ਕੋਡ ਸਕੈਨ ਕਰੋ।


ਪੇਜ ਅੰਤਿਮ ਅੱਪਡੇਟ ਦੀ ਤਾਰੀਖ: null


